
Descrizione
Questo indicatore VIX proprietario, alimentato da Average True Range (ATR), offre un'analisi precisa e chiara della volatilità del mercato, ottimizzata per cTrader 5.5.13+. Combina il movimento scalato del VIX con l'analisi del volume per confermare cambiamenti importanti e potenziali breakout.
Caratteristiche principali e qualità del codice
- Zero Bug/Avvisi: Completamente rifattorizzato con l'ultima API di cTrader, eliminando tutti gli errori e avvisi legacy per massima stabilità e prestazioni.
- VIX basato su ATR: Fornisce una misura reattiva della volatilità, normalizzata per individuare condizioni di mercato estreme.
- Doppia conferma: Utilizza la volatilità (linea VIX) combinata con i dati del Tick Volume per convalidare avvisi di breakout ad alta probabilità.
Personalizza la tua configurazione per una massima comprensione
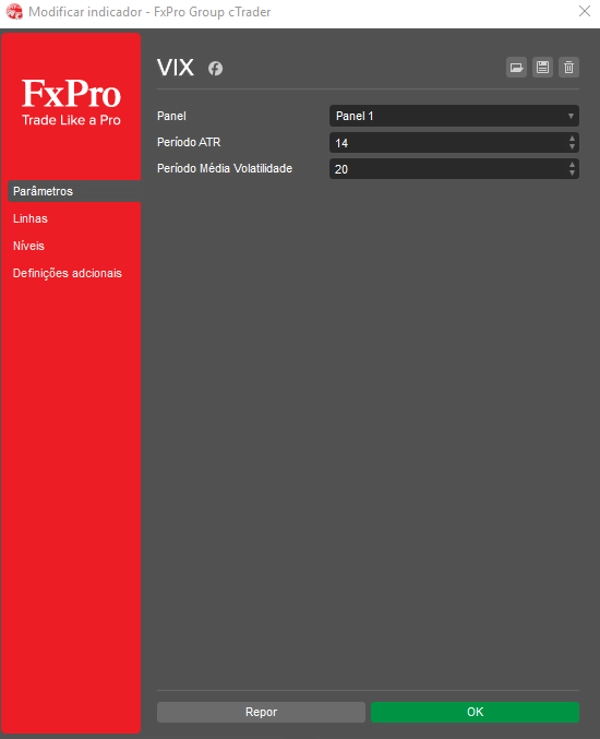
Regola facilmente l'indicatore per adattarlo alla tua strategia di trading impostando i valori desiderati per Livello VIX Basso e Livello VIX Alto. Inoltre, regola il Fattore di Scala VIX per controllare con precisione l'altezza e la visualizzazione della linea VIX nel pannello inferiore.
Come interpretare i segnali di breakout e consolidamento
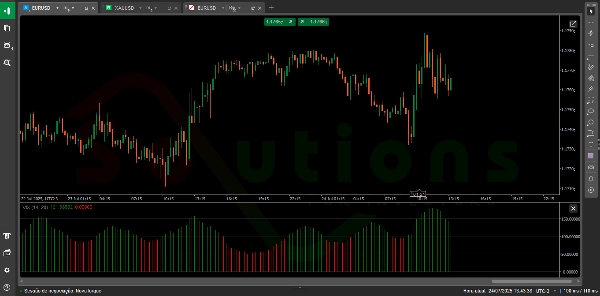
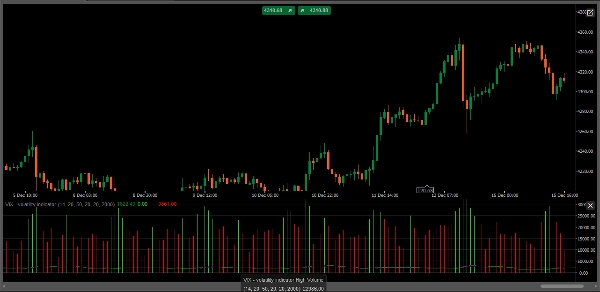
- Avviso di breakout (alta volatilità): Quando la linea VIX supera nettamente il Livello VIX Alto E è accompagnata da un alto volume (indicato dall'istogramma Alto Volume), questo conferma paura/avidità estreme e segnala un breakout di mercato ad alta probabilità.
- Segnale di consolidamento (bassa volatilità): Quando la linea VIX scende sotto il Livello VIX Basso, spesso indica un periodo di calma del mercato, consolidamento stretto o potenziale inversione alla media — ideale per preparare la tua prossima mossa o ridurre il rischio.
- Approfondimenti sul volume: L'indicatore traccia gli istogrammi di Alto Volume (Verde) e Basso Volume (Rosso) sullo sfondo, permettendoti di valutare istantaneamente la liquidità e la convinzione dietro l'azione di prezzo corrente.
Riepilogo
Key features include:
- ATR-based VIX calculation for responsive volatility measurement normalized to detect extreme market conditions.
- Volume analysis with high (green) and low (red) volume histograms to assess liquidity and conviction behind price movements.
- Customizable parameters allowing users to set Low VIX Level and High VIX Level thresholds, as well as adjust the VIX Scale Factor for optimal visualization.
Usage signals:
- A breakout alert occurs when the VIX line surpasses the High VIX Level accompanied by high volume, indicating potential market breakouts driven by extreme fear or greed.
- A consolidation signal is identified when the VIX falls below the Low VIX Level, suggesting periods of low volatility, market calm, or potential mean reversion.
This indicator supports analysis across various markets including Forex, indices, commodities, stocks, and cryptocurrencies.
Recensioni dei clienti
5 | 50 % | |
4 | 50 % | |
3 | 0 % | |
2 | 0 % | |
1 | 0 % |


