
Descrizione
HIO Inside Bar Scanner Standard: Non perdere mai un setup su cTrader!
1. Introduzione
Non perdere mai più un'opportunità di trading con l'HIOInsideBarScanner! Questo assistente definitivo per cTrader scansiona l'intero mercato per scoprire setup Inside Bar ad alta probabilità. Smetti di sfogliare manualmente i grafici—lascia che sia il sistema a fare il lavoro pesante per te!
2. Caratteristiche principali
- Dashboard tutto-in-uno: Monitora dozzine di coppie e timeframe attraverso una singola e elegante griglia.
- Individuazione precisa dei breakout: Ricevi avvisi immediati quando il prezzo rompe un Inside Bar o Mother Bar, completo di rilevamento dei falsi segnali.
- Popup mini-grafico intelligente: Clicca per visualizzare istantaneamente un mini grafico del segnale, risparmiando tempo prezioso per l'analisi.
3. Guida al setup e analisi dei parametri
Questo indicatore è progettato per essere personalizzato al 100% in base alla tua strategia. Ecco come puoi perfezionare la tua macchina di scansione definitiva:
- Impostazioni generali:
-
- Elenco simboli: Inserisci le coppie di valute target (es. EURUSD, GBPUSD, AUDUSD), separate da virgole. Scansionale tutte contemporaneamente!
- Elenco timeframe: Definisci il tuo approccio digitando i timeframe preferiti (es. H1, H4, D1). Supporta tutto, da M1 per gli scalper a MN1 per i trader a lungo termine.
- Avvisi e segnali:
-
- Barre di scadenza del segnale: Definisci per quante barre un segnale di breakout rimane valido (Predefinito: 1). Evita ingressi tardivi quando il momentum è finito!
- Abilita segnali di breakout IB (IBI/IBIF): Attiva per ricevere avvisi quando il prezzo rompe i confini dell'Inside Bar (Include rilevamento dei falsi segnali).
- Abilita segnali di breakout MB (IB/IBF): Attiva gli avvisi per veri breakout della Mother Bar—una forte conferma di continuazione o inversione del trend.
- Regole intelligenti per Inside Bar:
-
- Corpo IB dentro corpo MB: Filtro rigoroso che richiede che il corpo dell'Inside Bar sia completamente contenuto all'interno del corpo della Mother Bar.
- Intero IB dentro corpo MB: La regola più rigorosa—l'intero Inside Bar (compresi i wicks) deve stare all'interno del corpo della Mother Bar.
- Ignora MB consecutivi: Salta le Mother Bar consecutive per aiutarti a concentrarti solo sui setup di breakout freschi e iniziali.
- Corpo MB > Corpo IB: Garantisce che il corpo della Mother Bar sia più grande di quello dell'IB, filtrando le formazioni deboli.
- Wicks totali MB < Corpo MB: Filtra le Mother Bar disordinate assicurando che la dimensione totale dei wicks sia inferiore al corpo. Dì addio al rumore di mercato!
- Ignora wicks IB/MB: Forza lo scanner a calcolare i breakout basandosi solo sui prezzi di apertura/chiusura delle candele anziché sui massimi/minimi dei wicks.
- Aspetto visivo:
-
- Mostra linee MB/IB sul grafico principale: Disegna automaticamente linee di confine pulite per MB e IB direttamente sul tuo grafico principale.
- Impostazioni mini grafico: Attiva le linee di confine sul popup del mini grafico e regola larghezza/altezza per adattarlo perfettamente allo schermo.
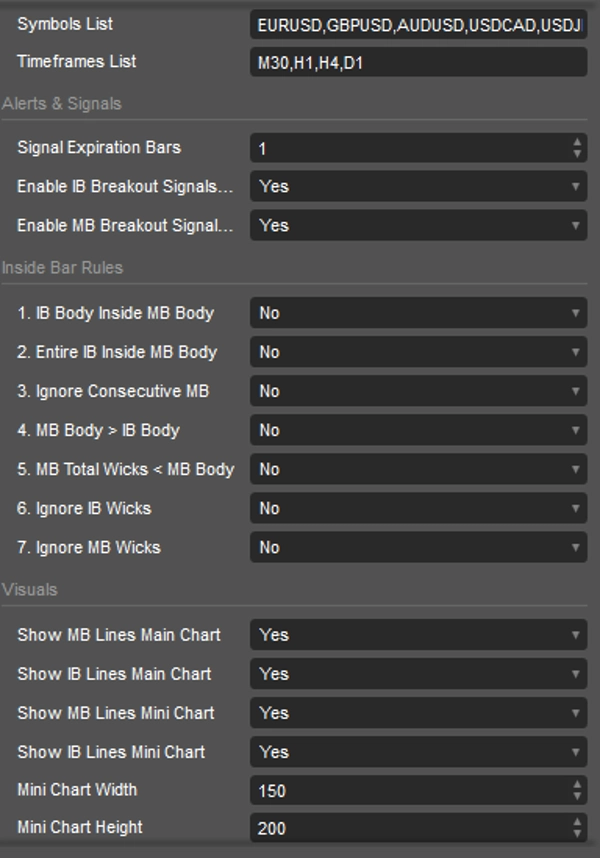
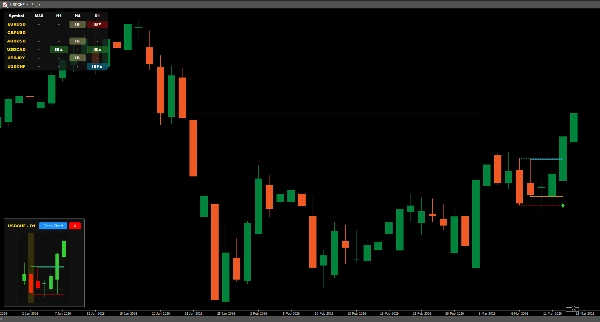
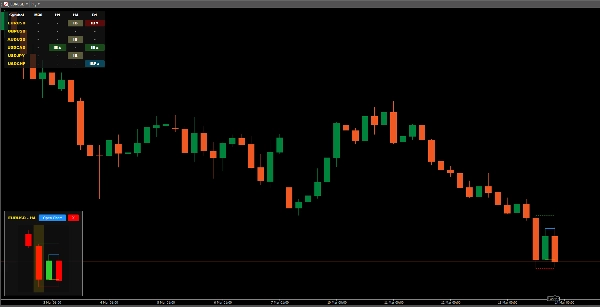
4. Guida ai simboli della dashboard: Leggi il mercato a colpo d'occhio
La dashboard di HIOInsideBarScanner utilizza simboli intuitivi per aiutarti a comprendere immediatamente l'azione del prezzo in corso:
- IB: Si è formato un nuovo Inside Bar. (Preparati a un potenziale breakout!)
- IBI▲: Il prezzo ha chiuso sopra il massimo dell'Inside Bar. (Breakout rialzista precoce)
- IBI▼: Il prezzo ha chiuso sotto il minimo dell'Inside Bar. (Breakout ribassista precoce)
- IBIF▲: Il prezzo è sceso sotto il minimo della Mother Bar, poi è tornato a chiudere sopra il massimo dell'Inside Bar. (Falso segnale ribassista - Ottima opportunità di acquisto)
- IBIF▼: Il prezzo è salito sopra il massimo della Mother Bar, poi è tornato a chiudere sotto il minimo dell'Inside Bar. (Falso segnale rialzista - Ottima opportunità di vendita)
- IB▲: Il prezzo ha chiuso sopra il massimo della Mother Bar. (Forte conferma di breakout rialzista)
- IB▼: Il prezzo ha chiuso sotto il minimo della Mother Bar. (Forte conferma di breakout ribassista)
- IBF▲: Il prezzo è sceso sotto il minimo della Mother Bar, poi è violentemente tornato a chiudere sopra il massimo della Mother Bar. (Trappola ribassista importante)
- IBF▼: Il prezzo è salito sopra il massimo della Mother Bar, poi è violentemente tornato a chiudere sotto il minimo della Mother Bar. (Trappola rialzista importante)
Riepilogo
Key functionalities include real-time alerts for breakouts of Inside Bars and Mother Bars, with built-in fakeout detection to enhance signal reliability. Users can customize symbol and timeframe lists, set signal expiration periods, and toggle specific breakout alerts. The indicator applies strict filtering rules based on candle body and wick relationships to refine pattern recognition and reduce noise.
A smart mini-chart popup allows quick visual analysis of signals without switching charts. Visual boundary lines for Inside Bars and Mother Bars can be displayed on the main chart and mini-chart for clarity. The dashboard uses intuitive symbols to convey the status of price action, such as new Inside Bars, bullish or bearish breakouts, and fakeout scenarios.
This tool supports a range of trading styles from scalping to long-term strategies by accommodating timeframes from one minute to monthly charts. It is adaptable to user strategies through detailed parameter settings, facilitating tailored market scanning and breakout detection.
Recensioni dei clienti
5 | 100 % | |
4 | 0 % | |
3 | 0 % | |
2 | 0 % | |
1 | 0 % |


