คำอธิบาย
Signal Strike เป็นตัวบ่งชี้การเทรดมืออาชีพที่ออกแบบมาสำหรับ ctrader ซึ่งให้สัญญาณเข้าเทรดที่ชัดเจนและมั่นใจสูงโดยตรงบนกราฟของคุณ สร้างขึ้นด้วยตรรกะขั้นสูงที่ผสมผสานแนวโน้ม โมเมนตัม ความผันผวน และการยืนยันปริมาณ เครื่องมือนี้ช่วยให้นักเทรดระบุโอกาสซื้อและขายที่แม่นยำด้วยความมั่นใจ
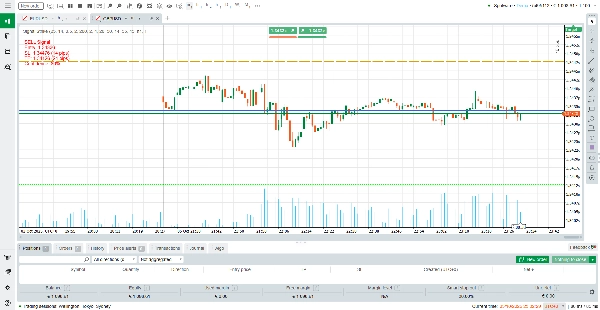
แตกต่างจากตัวบ่งชี้ทั่วไป Signal Strike ถูกออกแบบมาเพื่อกรองแท่งเทียนที่ไม่แน่ใจและการตั้งค่าที่อ่อนแอ เมื่อเงื่อนไขตรงกัน ตัวบ่งชี้จะแสดงระดับการเข้าเทรด จุดหยุดขาดทุน และจุดทำกำไรโดยตรงบนกราฟ พร้อมกับเปอร์เซ็นต์ความมั่นใจ หากไม่พบการตั้งค่าที่ถูกต้อง ตัวบ่งชี้จะแสดงข้อความ “No valid BUY/SELL signal” ที่ด้านบนของกราฟ — เพื่อให้คุณรู้เสมอว่าเมื่อใดควรดำเนินการและเมื่อใดควรหลีกเลี่ยง
ใน Signal Strike สีของเส้นแต่ละเส้นมีความหมายชัดเจนเพื่อช่วยให้นักเทรดอ่านกราฟได้ทันที เส้นเข้าเทรดจะวาดด้วยสีน้ำเงิน ซึ่งแสดงราคาที่แน่นอนที่เกิดการตั้งค่าเทรด เส้นหยุดขาดทุนจะปรากฏเป็นสีส้ม แสดงระดับป้องกันที่เทรดจะถูกปิดหากตลาดเคลื่อนไหวสวนทางกับคุณ
เส้นทำกำไรจะแสดงเป็นสีเขียวมะนาว เน้นระดับเป้าหมายที่ล็อกกำไร สำหรับความชัดเจนในทิศทาง สัญญาณซื้อจะเน้นด้วยสีเขียว ในขณะที่สัญญาณขายจะเน้นด้วยสีแดง สีที่เข้มและสดเหล่านี้ช่วยให้แต่ละองค์ประกอบโดดเด่น ทำให้ง่ายต่อการแยกแยะระหว่างโซนเข้าเทรด ความเสี่ยง และรางวัลได้ในทันที
วิธีอ่านสัญญาณ
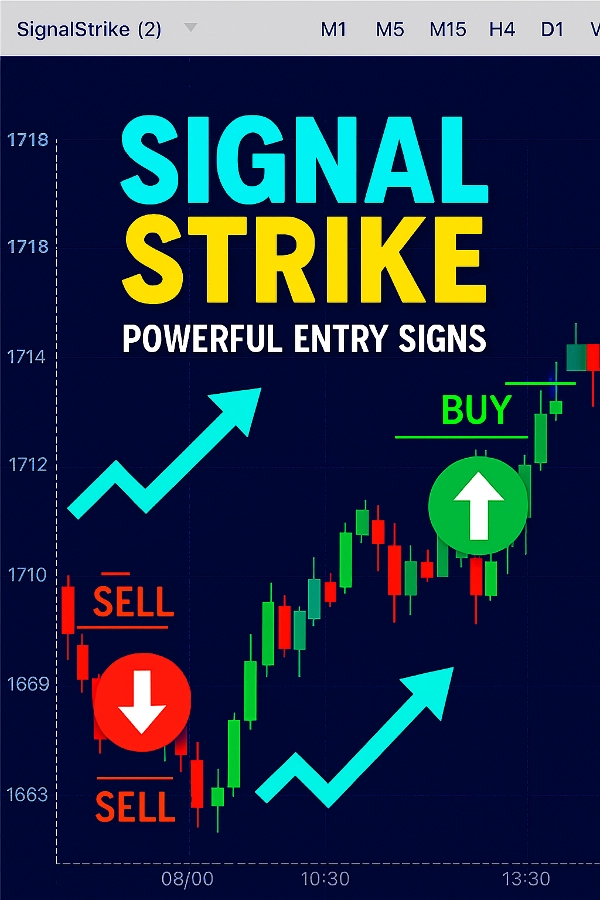
สัญญาณซื้อ (BUY): จะมีลูกศรชี้ขึ้นสีเขียวและป้ายแสดงราคาที่เข้าเทรด จุดหยุดขาดทุน จุดทำกำไร และระดับความมั่นใจ
สัญญาณขาย (SELL): จะมีลูกศรชี้ลงสีแดงและป้ายแสดงรายละเอียดเดียวกัน
ไม่มีสัญญาณ: หากเงื่อนไขตลาดไม่แข็งแกร่งพอ ตัวบ่งชี้จะแสดงข้อความ “No valid BUY/SELL signal” ที่ด้านบนของกราฟ
TP/SL แบบไดนามิก: ระดับทำกำไรและหยุดขาดทุนจะปรับโดยอัตโนมัติตามความผันผวนและเงื่อนไข RSI
เพื่อเพิ่มผลลัพธ์สูงสุด แนะนำให้สลับระหว่างกรอบเวลา (M1, M5, M15, H1, H4) เพื่อค้นหาสัญญาณที่ชัดเจนที่สุดสำหรับสไตล์การเทรดของคุณ
วิธีการทำงานของตัวบ่งชี้
Signal Strike ผสมผสานการวิเคราะห์หลายชั้น:
การตรวจจับแนวโน้ม (Trend Detection)
ตัวกรองโมเมนตัม (Momentum Filter)
การตรวจสอบความผันผวน (Volatility Check)
การยืนยันปริมาณ (Volume Confirmation)
ตัวกรองความไม่แน่ใจ – แท่งเทียนเล็กและอ่อนแอจะถูกละเว้นเพื่อหลีกเลี่ยงการเข้าเทรดผิดพลาด
เฉพาะเมื่อเงื่อนไขเหล่านี้ตรงกัน ตัวบ่งชี้จึงสร้างสัญญาณซื้อหรือขาย ซึ่งช่วยให้มั่นใจว่าสัญญาณทุกอันได้รับการยืนยันหลายชั้น ลดเสียงรบกวนและเพิ่มความแม่นยำ
คุณสมบัติหลัก (5 จุดเด่น)
ระดับเข้าเทรด, SL, และ TP ที่ชัดเจน – มองเห็นได้ทันทีบนกราฟ
เปอร์เซ็นต์ความมั่นใจ – รู้ความแข็งแกร่งของสัญญาณทุกครั้งก่อนเข้าเทรด
รองรับหลายกรอบเวลา – ใช้งานได้กับทุกกรอบเวลาตั้งแต่ M1 ถึง H4
การกรองอัตโนมัติ – หลีกเลี่ยงสัญญาณผิดพลาดในช่วงเวลาที่ไม่แน่ใจหรือปริมาณต่ำ
ป้ายแสดงที่ใช้งานง่าย – อ่านง่าย พร้อมแสดง “No Signal” เมื่อเงื่อนไขไม่ครบถ้วน
การตั้งค่าที่แนะนำตามกรอบเวลา
ตัวบ่งชี้มีอินพุตที่ยืดหยุ่น (LookbackCandles, ATRPeriod, ATRMultiplier, ช่วง SMA, ระดับ RSI ฯลฯ) ด้านล่างนี้เป็นการตั้งค่าที่ปรับแต่งสำหรับสไตล์การเทรดที่แตกต่างกัน:
M1 (สเกลปิ้ง)
LookbackCandles: 20
ATRPeriod: 10
ATRMultiplier: 0.4
SMA Fast/Slow: 10 / 30
RSI: 12 (ซื้อ > 55, ขาย < 45) → เหมาะสำหรับสเกลปิ้งระยะสั้นมากที่มีการเข้าเทรดรวดเร็ว
M5 (อินเทรดเดย์เร็ว)
LookbackCandles: 25
ATRPeriod: 14
ATRMultiplier: 0.5
SMA Fast/Slow: 20 / 50
RSI: 14 (ซื้อ > 55, ขาย < 45) → สมดุลสำหรับการเทรดอินเทรดเดย์ระยะสั้น
M15 (อินเทรดเดย์สวิง)
LookbackCandles: 30
ATRPeriod: 14
ATRMultiplier: 0.6
SMA Fast/Slow: 20 / 60
RSI: 14 (ซื้อ > 56, ขาย < 44) → เหมาะสำหรับจับการเคลื่อนไหวอินเทรดเดย์ระดับกลาง
H1 (สวิงเทรดดิ้ง)
LookbackCandles: 40
ATRPeriod: 20
ATRMultiplier: 0.7
SMA Fast/Slow: 30 / 80
RSI: 14 (ซื้อ > 57, ขาย < 43) → ตัวกรองที่แข็งแกร่งขึ้นสำหรับสวิงในกรอบเวลาที่สูงกว่า
H4 (โพสิชันเทรดดิ้ง)
LookbackCandles: 50
ATRPeriod: 20
ATRMultiplier: 0.8
SMA Fast/Slow: 50 / 100
RSI: 14 (ซื้อ > 58, ขาย < 42) → เหมาะสำหรับการเข้าเทรดระยะยาวที่มั่นใจสูง
ทำไมต้องเลือก Signal Strike?
Signal Strike ไม่ใช่แค่ตัวบ่งชี้ทั่วไป แต่เป็นเครื่องมือช่วยตัดสินใจที่ช่วยประหยัดเวลา ลดความไม่แน่นอน และช่วยให้นักเทรดมุ่งเน้นที่โอกาสที่ดีที่สุด ไม่ว่าคุณจะเป็นสเกลเปอร์บน M1 หรือสวิงเทรดเดอร์บน H4 Signal Strike ปรับตัวเข้ากับสไตล์ของคุณและให้สัญญาณเข้าเทรดที่ทรงพลังด้วยความชัดเจนและแม่นยำ
ควบคุมการเทรดของคุณด้วย Signal Strike และสัมผัสความแตกต่างของการเทรดด้วยความมั่นใจ
สรุป
When a valid trade setup occurs, Signal Strike plots entry, stop loss, and take profit levels on the chart, each color-coded for clarity: blue for entry, orange for stop loss, and lime green for take profit. BUY signals are marked with green arrows and labels, while SELL signals use red. A confidence percentage accompanies each signal to indicate its strength. If no valid setup is detected, a “No valid BUY/SELL signal” message appears.
The indicator supports multiple timeframes from M1 to H4, with recommended settings optimized for scalping, intraday, swing, and position trading styles. Take profit and stop loss levels adjust dynamically based on volatility and RSI conditions. Signal Strike aims to assist traders in making informed decisions by highlighting clear entry points, risk levels, and profit targets across various markets including Forex, commodities, crypto, and stocks.
รีวิวจากลูกค้า
5 | 50 % | |
4 | 0 % | |
3 | 50 % | |
2 | 0 % | |
1 | 0 % |