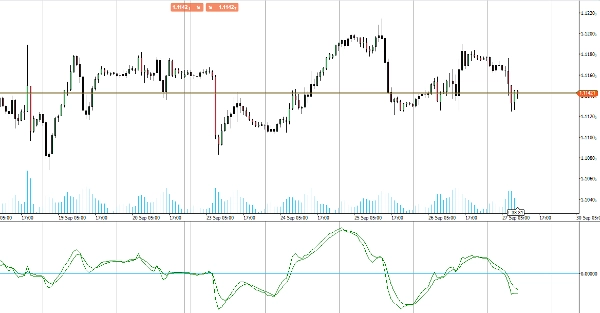
"RT True Strength Index" 로고
RT True Strength Index
지표
1 구매
버전 1.0, Sep 2024
Windows, Mac
"RT True Strength Index" 업로드된 이미지
가입일 25/09/2024
20
판매

Introducing the True Strength Index (TSI) indicator, a powerful tool designed to enhance your trading strategy by providing clear insights into market momentum and trend strength.

The TSI indicator measures the underlying strength of price movements, smoothing out market noise to give you a more accurate picture of trend direction. By highlighting overbought and oversold conditions, TSI helps you identify potential reversal points and confirm trend continuations.

TSI uses moving averages of the underlying momentum of a financial instrument. Momentum is considered a leading indicator of price movements, and a moving average characteristically lags behind price. The TSI combines these characteristics to create an indication of price and direction more in sync with market turns than either momentum or moving average.

Perfect for traders seeking to refine their analysis and improve decision-making, the TSI indicator offers a reliable and intuitive way to gauge market dynamics. Upgrade your trading toolkit with the True Strength Index for superior trading performance.

Indicator profile
0.0
리뷰: 0
고객 리뷰
이 상품에 대한 리뷰가 아직 없습니다. 이미 사용해 보셨나요? 다른 사람들에게 가장 먼저 소개해 주세요!
BTCUSD
Forex
Indices
EURUSD
Commodities
GBPUSD
NZDUSD
Crypto
Stocks
XAUUSD
NAS100
USDJPY
Products available through cTrader Store, including trading bots, indicators and plugins, are provided by third-party developers and made available for informational and technical access purposes only. cTrader Store is not a broker and does not provide investment advice, personal recommendations or any guarantee of future performance.

좋아하실 만한 다른 항목

"Daily Fibo" 로고
최고 평점
4.5
(2)
무료
지표
Indices
Crypto
+2
Daily Fibo
지표
SMC
Indices
+7
The only cTrader FVG indicator with Breakaway Gap detection, mitigation tracking, and full multi-asset compatibility.
지표
ADX
Bollinger Bands
+5
10 Factors. One Signal. Zero Guesswork.
지표
XAUUSD
GBPUSD
+5
SUPER TREND OSCILLATOR TRIAL DAY15
지표
Forex
Commodities
Indicador Compra e Venda é um rastreador de tendência.
지표
ADX
Liquidity Sweep
+5
Regime-aware SMC indicator scoring BOS/CHoCH, OBs, FVGs & liquidity sweeps 0-10 with structure-based TPs
지표
Signal
Breakout
A precision tool for measuring how efficiently price moves from point A to B.
지표
Indices
Crypto
+7
An indicator that redefines ATR by applying a percentile-based filter giving traders a grounded view of volatility.
지표
RSI
MACD
+1
Identify Overbought & Oversold Levels Like a Pro!
지표
Supertrend
Signal
+1
Innovative indicator that highlights trend direction and momentum strength quickly and clearly on Forex charts.
지표
AI
Fibonacci
+27
Support and Resistance with signals
지표
XAUUSD
Indices
+17
Auto-detect support and resistance & trendlines, highlight pullbacks/BOS retests, and filter with candle confirmation.
지표
NZDUSD
GBPUSD
+3
Show each Market Session with full details, including grid mode for higher timeframes, statistics, and other metrics.
지표
EURUSD
Forex
ECONOMIC FOREX:provides insights into inflation, nominal interest rates and real interest rates, in the line chart
지표
XAUUSD
Indices
+5
The Woodie CCI Indicator (Woodie Commodity Channel Index) is a variation of the classic CCI indicator
지표
Indices
Crypto
+4
Visualize the four major trading sessions with color-coded rectangles showing session high/low ranges.
지표
Indices
Crypto
+3
Super EMA the best EMA indicator
지표
Brooks price action breakout mode patterns
가입일 25/09/2024
20
판매