
Penerangan
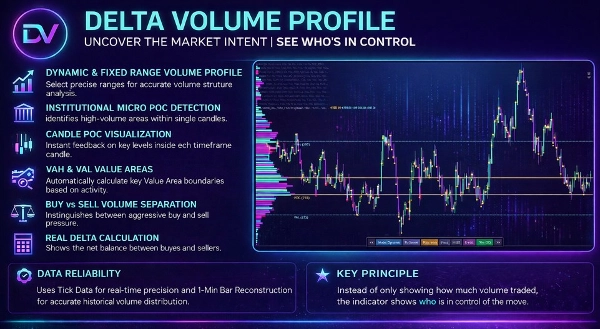
Profil Isipadu Pro Lanjutan: Julat Tetap Institusi & Aliran Pesanan
Tingkatkan analisis pasaran anda dengan Profil Isipadu Pro Lanjutan, penunjuk tahap institusi yang sangat dioptimumkan yang direka untuk pedagang. Dibina untuk pedagang harian, scalper, dan pedagang ayunan yang bergantung pada Teori Pasaran Lelongan, alat ini membawa ketepatan kepada Pengagihan Isipadu, Kawasan Nilai, dan dinamik Aliran Pesanan.
Tidak seperti profil isipadu runcit standard yang sentiasa mengira semula, bergeser, atau pecah apabila anda mengezum masuk dan keluar, penunjuk ini memperkenalkan Mod Sauh Sebenar (Julat Tetap) dengan pengekalan memori, menjadikannya alat terbaik untuk dagangan langsung dan ujian sejarah yang ketat.
🔥 Ciri Teras & Kelebihan Dagangan
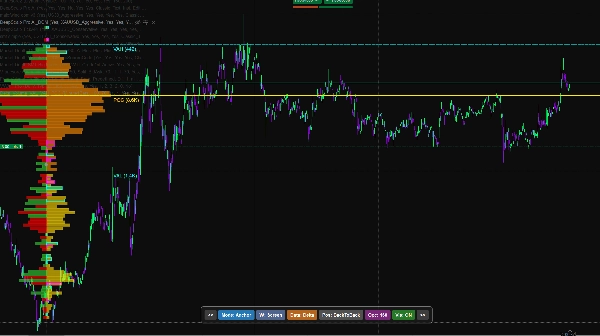
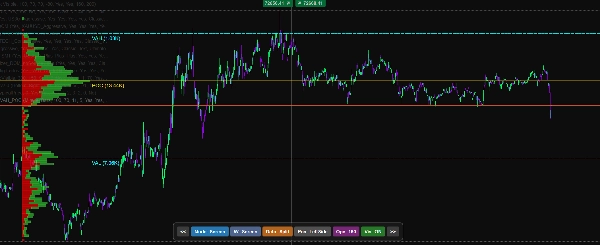
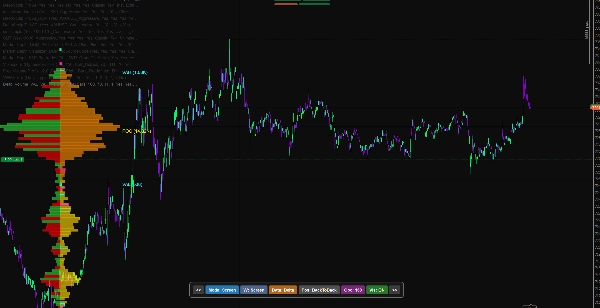
1. Mod Sauh Sebenar (Sesuai untuk ujian sejarah)
Berhenti bergelut dengan profil yang bergeser! Dengan Mod Sauh kami, anda boleh meletakkan dua garis menegak interaktif di mana-mana pada carta anda untuk menganalisis ayunan, sesi, atau zon pengukuhan tertentu.
- Tiada Distorsi: Zum masuk, zum keluar, atau skrol—profil kekal terkunci secara matematik pada titik sauh pilihan anda.
- Ujian sejarah: Skrol kembali berbulan-bulan atau bertahun-tahun, sauh profil kepada peristiwa pasaran lalu, dan analisis pengagihan isipadu tepat serta Titik Kawalan (POC) seperti yang berlaku. Sauh mengingati kedudukan tepat mereka, membolehkan anda mengkaji susunan lalu dengan sempurna tanpa grid menetapkan semula.
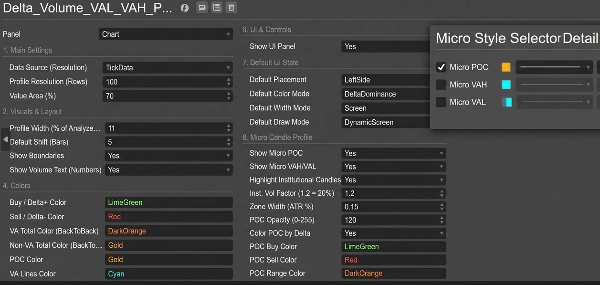
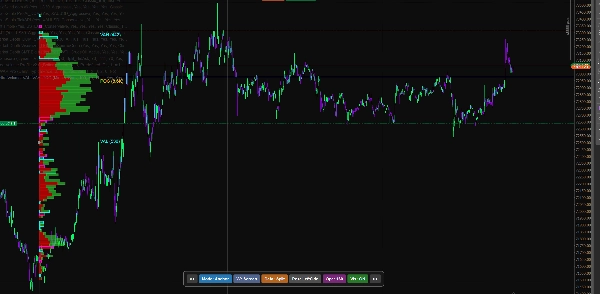
2. Panel UI Interaktif Pada Carta
Tidak perlu sentiasa membuka tetapan penunjuk. Panel UI yang kemas dan tidak mengganggu di bahagian bawah carta anda membolehkan anda:
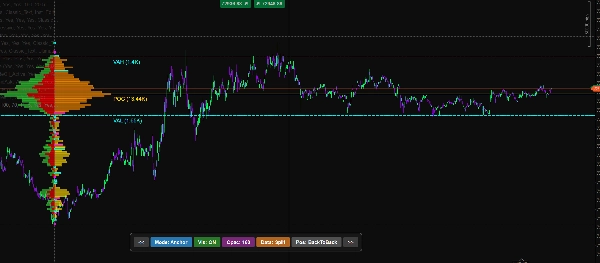
- Beralih antara Mod Skrin (Dinamik) dan Mod Sauh (Julat Tetap) dengan satu klik.
- Menggeser kedudukan profil (Kiri, Kanan, Belakang-ke-Belakang).
- Laraskan Lebar Visual dan Ketelusan secara langsung.
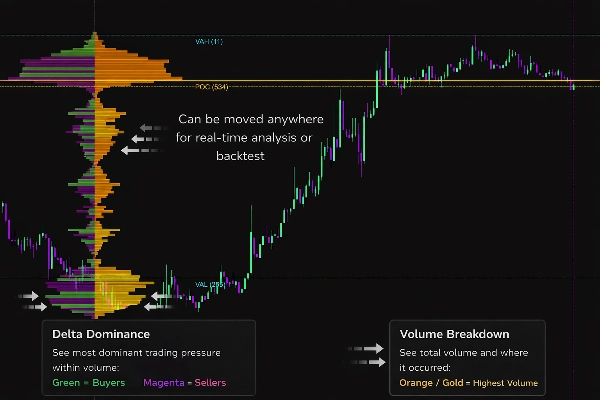
- Beralih antara Pecahan Beli/Jual dan Dominasi Delta dalam pewarnaan isipadu.
3. Wawasan Mendalam Aliran Pesanan
Baca mikro-struktur pasaran seperti seorang profesional:
- Dominasi & Pecahan Delta: Visualisasikan pembelian pasaran agresif berbanding penjualan pasaran dalam setiap nod harga.
- Ketidakseimbangan Isipadu: Mengesan dan menyerlahkan secara automatik ketidakseimbangan beli/jual besar (nisbah boleh disesuaikan, contohnya, dominasi 300%) untuk mengenal pasti penyerapan institusi atau pecahan agresif.
- Pengesanan HVN & LVN: Mengenal pasti dengan jelas Nod Isipadu Tinggi (magnet untuk harga) dan Nod Isipadu Rendah (kekosongan kecairan di mana harga bergerak dengan pantas).
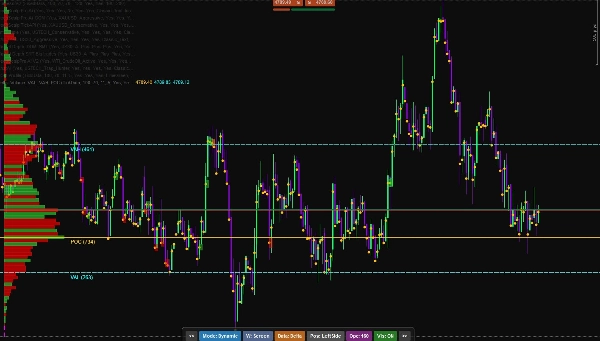
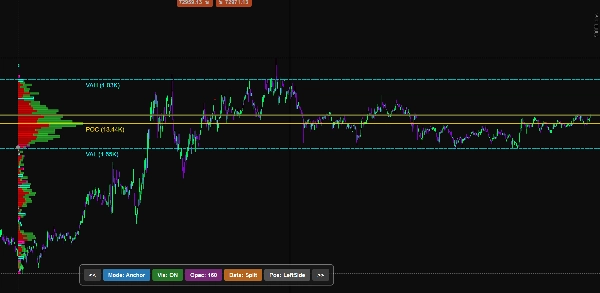
4. Kawasan Nilai Dinamik & POC Telanjang
- Memaparkan tepat Nilai Kawasan Tinggi (VAH) dan Nilai Kawasan Rendah (VAL) berdasarkan sisihan piawai (default 70%).
- Menyorot Titik Kawalan (POC).
- Lanjutkan POC Telanjang: Secara automatik melanjutkan garis POC yang tidak diperiksa ke masa depan, memberikan anda sasaran sokongan dan rintangan yang sangat responsif.
5. Sangat Dioptimumkan
- Sumber Data: Pilih antara Data Tick yang sangat tepat atau data Bar 1-Minit yang ringan untuk analisis sejarah jangka panjang.
- Rendering Pintar: Direka untuk mengendalikan jumlah data yang besar tanpa membekukan platform anda.
🛠️ Cara Menggunakannya untuk pembelajaran apabila tidak berdagang:
- Skrol kembali ke tarikh yang anda inginkan pada carta.
- Klik "Mod: Sauh" pada panel UI.
- Seret dua garis bertitik menegak untuk merangkumi ayunan harga tepat atau sesi dagangan yang anda ingin analisis.
- Profil Isipadu dijana serta-merta. Anda boleh mengezum ke carta 1-minit untuk memeriksa titik masuk tepat, ketidakseimbangan, dan ujian semula Kawasan Nilai tanpa profil kehilangan tempatnya!
Kawal carta anda. Berhenti berdagang corak runcit dan mulakan berdagang isipadu institusi.
Ringkasan
An interactive on-chart UI panel enables quick toggling between dynamic Screen Mode and fixed Anchor Mode, profile position adjustments, visual customization, and switching between Buy/Sell Split and Delta Dominance volume coloring. The tool offers deep order flow insights, including visualization of aggressive buying versus selling, automatic detection of volume imbalances, and identification of High Volume Nodes (HVN) and Low Volume Nodes (LVN).
It displays dynamic Value Area High (VAH), Value Area Low (VAL), and Point of Control (POC) lines, with an option to extend naked POC lines as future support/resistance targets. Users can select data sources between tick data and 1-minute bars for optimized performance and historical analysis. The indicator is engineered for efficient rendering to handle large datasets without platform lag.
Ulasan pelanggan
5 | 50 % | |
4 | 50 % | |
3 | 0 % | |
2 | 0 % | |
1 | 0 % |


