
HA
Indicatore
2 acquisti
Versione 1.0, Jan 2026
Windows, Mac
4.0
Recensioni: 1
Descrizione
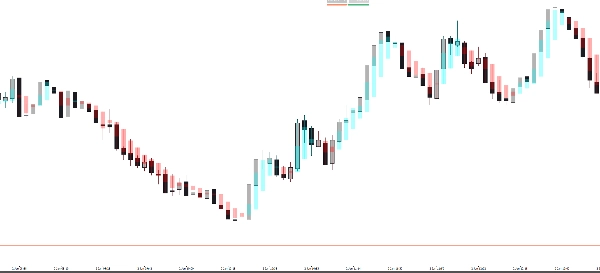
Il Pro Heikin Ashi Visual Overlay è lo strumento perfetto per i trader che vogliono i benefici di smussamento del trend delle candele Heikin Ashi mantenendo attivi i loro grafici a candele o a barre standard.
I grafici tradizionali Heikin Ashi richiedono di cambiare completamente il tipo di grafico, rendendo difficile vedere l'azione del prezzo esatta. Questo indicatore risolve il problema disegnando le candele Heikin Ashi come una sovrapposizione semi-trasparente, permettendoti di individuare immediatamente inversioni di trend e momentum di mercato senza perdere di vista il prezzo reale.
Perché usare questa Overlay?
- 💎 Riduzione del Rumore: Heikin Ashi filtra il rumore di mercato, rendendo più facile rimanere in operazioni vincenti.
- 🕯️ Vista Doppia del Grafico: Mantieni le tue candele standard per l'azione del prezzo/pattern mentre usi l'overlay HA per la direzione del trend.
- 🎨 Completamente Personalizzabile: Regola opacità e colori per adattarli al tuo spazio di lavoro (modalità Scura o Chiara).
- 🚀 Identificazione Immediata del Trend: Le zone Blu (rialziste) e Rosse (ribassiste) ti aiutano a evitare di operare contro il momentum.
Caratteristiche Principali:
- Trasparenza Intelligente: Imposta l'opacità in modo che l'overlay non nasconda la tua azione principale del prezzo.
- Allineamento Perfetto: Calcolato in tempo reale per corrispondere ai valori Heikin Ashi del timeframe corrente.
- Design Professionale: Visual puliti che non ingombrano il tuo grafico.
- Universale: Funziona su tutti i timeframe (da M1 a Mensile) e su tutti gli asset (Forex, Azioni, Cripto, Indici).
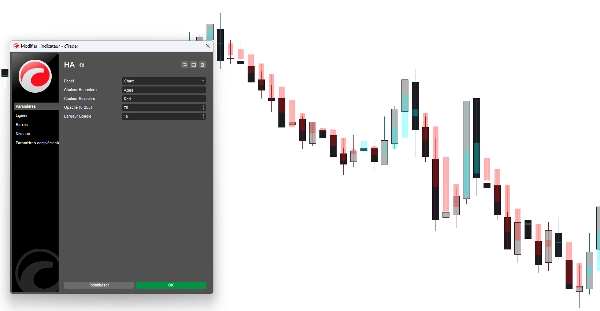
Come usarlo:
- Applica l'indicatore al tuo grafico.
- Regola Opacità e Larghezza del Corpo nelle impostazioni secondo le tue preferenze.
- Usa le candele HA per confermare la forza del trend:
-
- Ombre lunghe nella direzione del trend = Forte Momentum.
- Corpi piccoli con ombre su entrambi i lati = Potenziale Inversione.
Parametri:
- Colore Rialzista: Colore personalizzato per le candele HA al rialzo.
- Colore Ribassista: Colore personalizzato per le candele HA al ribasso.
- Opacità (0-255): Controlla quanto le candele appaiono "spettrali" o solide.
- Larghezza della Candela: Regola lo spessore delle candele HA per adattarsi perfettamente al tuo livello di zoom.
Riepilogo
Riepilogo AI
The Pro Heikin Ashi Visual Overlay is an indicator designed to enhance trend analysis by overlaying Heikin Ashi candles on standard candlestick or bar charts. Unlike traditional Heikin Ashi charts that replace the entire chart type, this tool provides a semi-transparent overlay, allowing traders to observe smoothed trend signals while retaining visibility of actual price action.
Key features include noise reduction to filter market fluctuations, customizable opacity and colors for integration with different chart backgrounds, and real-time alignment with the current timeframe’s Heikin Ashi calculations. The overlay uses blue and red zones to indicate bullish and bearish trends, aiding in immediate trend identification. It supports all timeframes from one minute to monthly and is compatible with various asset classes including Forex, stocks, cryptocurrencies, commodities, and indices.
Users can adjust candle width and opacity to suit their chart zoom level and visual preferences. The indicator facilitates dual-chart viewing, enabling simultaneous analysis of precise price patterns and smoothed trend momentum. It is designed with clean visuals to avoid chart clutter and supports professional trading environments.
Profilo indicatore
Recensioni dei clienti
4.0
Recensioni: 1
5 | 0 % | |
4 | 100 % | |
3 | 0 % | |
2 | 0 % | |
1 | 0 % |
Discussioni
Domande frequenti
Forex
Signal
Indices
Commodities
Crypto
Stocks
I prodotti disponibili tramite cTrader Store, inclusi bot di trading, indicatori e plugin, sono forniti da sviluppatori terzi e resi disponibili esclusivamente a scopo informativo e di accesso tecnico. cTrader Store non è un broker e non fornisce consulenze in materia di investimento, raccomandazioni individualizzate o garanzie di risultati futuri.
Altro da questo autore


![Logo di "[Stellar Strategies] Inside Bar with Signals"](https://cdn.ctrader.com/image/webp/1d9e8bfa-3b2c-4440-bb37-5856902008a7_30683)


Prezzo
Da 27/10/2025
10
Vendite