
Descrizione
Classic Proportional CVD (Ancorato)
Sblocca la vera intenzione dei partecipanti al mercato con il Classic Proportional CVD. A differenza degli indicatori standard di Cumulative Volume Delta che semplicemente sommano il volume dei tick, questo strumento utilizza una Logica Proporzionale per ponderare il volume basandosi sull'effettiva azione del prezzo all'interno di ogni barra.
Perché Delta "Proporzionale"?
Il CVD standard può essere fuorviante. Questo indicatore calcola il delta analizzando la relazione tra l'intervallo della barra (High-Low) e la distanza Close-Open. Questo assicura che il volume sia distribuito in modo realistico:
- Candele a forte convinzione (che chiudono vicino al massimo/minimo) contribuiscono maggiormente al delta.
- Candele con stoppini lunghi (segni di assorbimento o rifiuto) neutralizzano il delta, prevenendo segnali di volume "falsi".
Caratteristiche principali
- ⚓ Ancoraggio intelligente (Reset Multi-Timeframe): Mantieni la tua analisi rilevante per la sessione di trading corrente. Scegli di resettare il calcolo Giornalmente, Settimanale o Mensile—o lascialo funzionare indefinitamente.
- 📊 Visualizzazioni doppie:
-
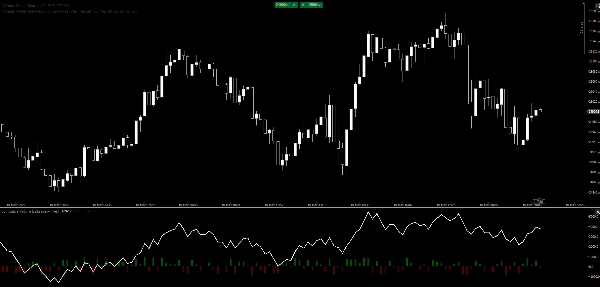
- La linea CVD: Una linea pulita e ad alte prestazioni per individuare divergenze a lungo termine e esaurimento del trend.
- Sovrapposizione istogramma: Feedback visivo immediato sulla pressione di acquisto/vendita per barra per identificare climax o assorbimento a colpo d'occhio.
- ⚡ Ultra-leggero: Scritto con ottimizzazione nativa C# per cTrader, garantendo zero ritardi anche su macchine di fascia bassa o mercati volatili.
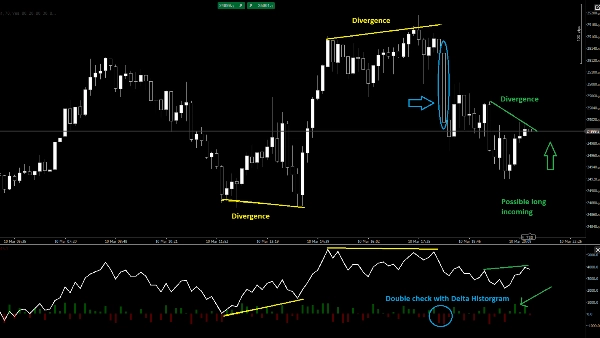
- 🎯 Individuazione delle divergenze: Identifica facilmente quando il prezzo fa nuovi massimi mentre il CVD fallisce—un segnale classico di distribuzione istituzionale.
Come fare trading con esso
- Conferma del trend: Cerca che la linea CVD segua la stessa direzione del prezzo.
- Assorbimento: Quando il prezzo raggiunge un nuovo minimo ma l'istogramma CVD mostra un forte "Delta Up" (Verde), gli acquirenti stanno assorbendo la pressione di vendita.
- Esaurimento: Osserva un picco netto nell'istogramma (Climax) seguito da un'inversione della linea CVD.
Parametri:
- Modalità ancoraggio: Mai, Giornaliero, Settimanale, Mensile.
- Mostra Delta Barra: Attiva/disattiva l'istogramma.
Sblocca la vera intenzione dei partecipanti al mercato con il Classic Proportional CVD. A differenza degli indicatori standard di Cumulative Volume Delta che semplicemente sommano il volume dei tick, questo strumento utilizza una Logica Proporzionale per ponderare il volume basandosi sull'effettiva azione del prezzo all'interno di ogni barra.
Perché Delta "Proporzionale"?
Il CVD standard può essere fuorviante. Questo indicatore calcola il delta analizzando la relazione tra l'intervallo della barra (High-Low) e la distanza Close-Open. Questo assicura che il volume sia distribuito in modo realistico:
- Candele a forte convinzione (che chiudono vicino al massimo/minimo) contribuiscono maggiormente al delta.
- Candele con stoppini lunghi (segni di assorbimento o rifiuto) neutralizzano il delta, prevenendo segnali di volume "falsi".
Caratteristiche principali
- ⚓ Ancoraggio intelligente (Reset Multi-Timeframe): Mantieni la tua analisi rilevante per la sessione di trading corrente. Scegli di resettare il calcolo Giornalmente, Settimanale o Mensile—o lascialo funzionare indefinitamente.
- 📊 Visualizzazioni doppie:
-
- La linea CVD: Una linea pulita e ad alte prestazioni per individuare divergenze a lungo termine e esaurimento del trend.
- Sovrapposizione istogramma: Feedback visivo immediato sulla pressione di acquisto/vendita per barra per identificare climax o assorbimento a colpo d'occhio.
- ⚡ Ultra-leggero: Scritto con ottimizzazione nativa C# per cTrader, garantendo zero ritardi anche su macchine di fascia bassa o mercati volatili.
- 🎯 Individuazione delle divergenze: Identifica facilmente quando il prezzo fa nuovi massimi mentre il CVD fallisce—un segnale classico di distribuzione istituzionale.
Come fare trading con esso
- Conferma del trend: Cerca che la linea CVD segua la stessa direzione del prezzo.
- Assorbimento: Quando il prezzo raggiunge un nuovo minimo ma l'istogramma CVD mostra un forte "Delta Up" (Verde), gli acquirenti stanno assorbendo la pressione di vendita.
- Esaurimento: Osserva un picco netto nell'istogramma (Climax) seguito da un'inversione della linea CVD.
Parametri:
- Modalità ancoraggio: Mai, Giornaliero, Settimanale, Mensile.
- Mostra Delta Barra: Attiva/disattiva l'istogramma.
Riepilogo
Key features include smart anchoring with multi-timeframe resets (daily, weekly, monthly, or continuous), dual visuals comprising a CVD line for spotting divergences and trend exhaustion, and a histogram overlay for immediate per-bar buying or selling pressure insights. The indicator is optimized in native C# for cTrader, ensuring high performance and low resource use.
Traders can use the indicator for trend confirmation by aligning CVD direction with price, identify absorption when price lows coincide with strong positive delta in the histogram, and detect exhaustion through histogram spikes followed by CVD reversals. Adjustable parameters include anchor mode and histogram display toggle.
This tool supports analysis across multiple markets and symbols, including Forex, cryptocurrencies, indices, commodities, and stocks.
Recensioni dei clienti
5 | 0 % | |
4 | 100 % | |
3 | 0 % | |
2 | 0 % | |
1 | 0 % |


![Logo di "[Stellar Strategies] MARSI Signal Plotter"](https://cdn.ctrader.com/image/webp/7b2b8da6-8f8e-4646-8d4a-4710c516c01e_25567)


