
คำอธิบาย
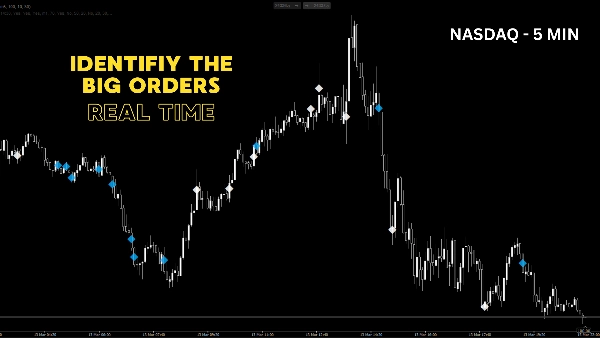
กลุ่มปริมาณที่ผิดปกติ คือเครื่องมือวิเคราะห์ปริมาณความแม่นยำสูงสำหรับ cTrader ที่ออกแบบมาเพื่อเปิดเผยรอยเท้าของสถาบันและกิจกรรมการซื้อขายที่รุนแรง ปริมาณมาก่อนราคา และตัวบ่งชี้นี้จะแสดงให้คุณเห็นอย่างชัดเจนว่า "เงินอัจฉริยะ" กำลังเข้าสู่ตลาดที่ใด
แทนที่จะพึ่งพาเกณฑ์ปริมาณคงที่และตายตัว ตัวบ่งชี้นี้ใช้ ตรรกะเปอร์เซ็นไทล์แบบเลื่อนที่เปลี่ยนแปลงได้ มันวิเคราะห์ประวัติศาสตร์ล่าสุดและเน้นเฉพาะแท่งเทียนที่มีปริมาณที่ผิดปกติจริงๆ (เช่น แท่งปริมาณสูงสุด 5% ในช่วง 200 ช่วงเวลา)
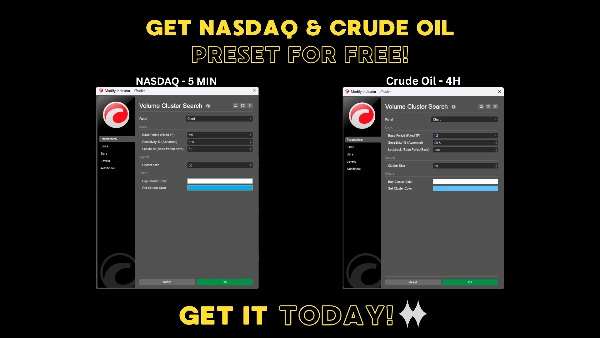
ข้อได้เปรียบที่ยิ่งใหญ่คือ ความสามารถหลายกรอบเวลา (MTF): คุณสามารถเทรดบนกราฟ 5 นาทีในขณะที่ตัวบ่งชี้ตรวจสอบอย่างเงียบๆ กรอบเวลา "ฐาน" ที่สูงกว่า (เช่น กราฟ 1 ชั่วโมง) สำหรับการเพิ่มขึ้นของปริมาณ โดยฉายกลุ่มสำคัญเหล่านั้นลงบนกราฟกรอบเวลาที่ต่ำกว่าของคุณตรงจุดที่เกิดขึ้นจริง
🔥 คุณสมบัติหลัก:
- ความไวแบบไดนามิก: ใช้เกณฑ์เปอร์เซ็นไทล์แบบเลื่อน (เช่น 95%) เพื่อปรับตัวโดยอัตโนมัติตามสภาพตลาดที่เงียบหรือผันผวนสูง
- หลายกรอบเวลาจริง: กรองเสียงรบกวนของตลาดโดยใช้กรอบเวลาฐานที่สูงกว่า ในขณะที่รักษาความแม่นยำของการเข้าเทรดในกรอบเวลาที่ต่ำกว่า
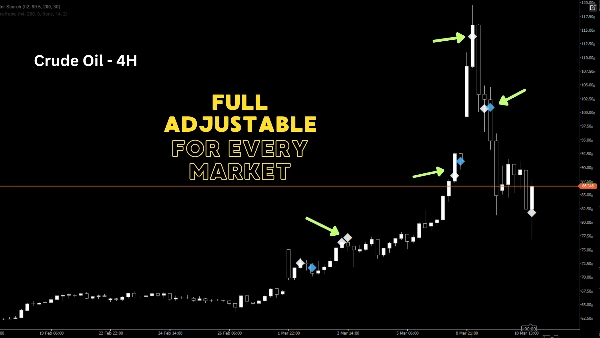
- กลุ่มทิศทาง: เหตุการณ์ปริมาณสุดขีดจะแสดงเป็นเครื่องหมายเพชร (◆) ที่ราคากลาง สีเขียวสำหรับการปิดแบบขาขึ้น สีแดงสำหรับการปิดแบบขาลง
- ปรับแต่งอย่างสูง: การจัดการหน่วยความจำในตัว (วัตถุที่วาดสูงสุด 2000 ชิ้น) ช่วยให้แพลตฟอร์ม cTrader ของคุณทำงานได้รวดเร็วเหมือนสายฟ้า
- ปรับแต่งได้เต็มที่: ปรับช่วงเวลาย้อนหลัง ความไว (%) กรอบเวลาฐาน ขนาดกลุ่ม และสีให้เหมาะกับสไตล์การเทรดส่วนตัวของคุณ
💡 วิธีใช้?
ปริมาณที่ผิดปกติมักบ่งชี้ถึงสองสิ่ง: การเริ่มต้นแนวโน้มขนาดใหญ่ (การเบรกเอาท์) หรือการยอมแพ้/การดูดซับ (การกลับตัว) โดยการสังเกตกลุ่มเหล่านี้ คุณสามารถระบุโซนแนวรับและแนวต้านที่ซ่อนอยู่โดยอิงจากเงินทุนที่ซื้อขายจริง ไม่ใช่แค่การเคลื่อนไหวของราคา เหมาะสำหรับนักเทรดรายวัน นักเทรดสั้น นักเทรดสวิง และนักเทรดที่ใช้ปริมาณในการหาจุดได้เปรียบจริง
สรุป
รีวิวจากลูกค้า
5 | 0 % | |
4 | 67 % | |
3 | 33 % | |
2 | 0 % | |
1 | 0 % |


!["[Stellar Strategies] Inside Bar with Signals" โลโก้](https://cdn.ctrader.com/image/webp/1d9e8bfa-3b2c-4440-bb37-5856902008a7_30683)

!["[CB] Pivot Points Pro" โลโก้](https://cdn.ctrader.com/image/webp/43463c82-67b0-4f10-a4ba-901bba091d81_32594)


