
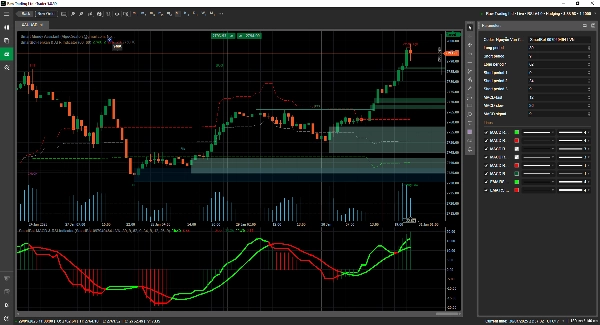
SmartBot-MACD & RSI Indicator
Indikator
4 käufe
Version 1.0, Jan 2025
Windows, Mac
4.3
Bewertungen: 3
Beschreibung
🚀 Präsentation des ultimativen MACD-RSI-Indikators! 🚀
Erleben Sie die perfekte Verschmelzung von MACD und RSI in einem einzigen, leistungsstarken Indikator! Dieses fortschrittliche Tool kombiniert die Momentumstärke des RSI mit der trendfolgenden Präzision des MACD und bietet Ihnen klarere Signale, weniger Rauschen und intelligentere Ein- & Ausstiege.
🔥 Warum diesen Indikator verwenden? 🔥
✅ Das Beste aus beiden Welten: RSI für Momentum + MACD zur Trendbestätigung.
✅ Genauere Signale: Eliminierung falscher Bewegungen und Verbesserung der Entscheidungsfindung.
✅ Perfekt für alle Trader: Funktioniert in allen Marktbedingungen und Handelsstilen.
Verbessern Sie noch heute Ihre Strategie mit diesem bahnbrechenden Indikator! 📈🔥
Zusammenfassung
Indikatorprofil
Kundenbewertungen
4.3
Bewertungen: 3
5 | 33 % | |
4 | 67 % | |
3 | 0 % | |
2 | 0 % | |
1 | 0 % |
Kundenbewertungen
January 21, 2025
Tested small first and that felt like the right move. Overconfidence is the real danger.
January 21, 2025
Diskussion
Häufig gestellte Fragen (FAQ)
RSI
MACD
Über den cTrader Store verfügbare Produkte, einschließlich Handelsbots, Indikatoren und Plugins, werden von externen Entwicklern bereitgestellt und nur zu Informations- und technischen Zugriffszwecken verfügbar gemacht. cTrader Store ist kein Broker und erbringt keine Anlageberatung, persönlichen Empfehlungen oder eine Garantie für zukünftige Performance.


Preis
Seit 29/11/2024
32
Verkäufe
979
Kostenlose Installationen