
คำอธิบาย
ปลดล็อกความเข้าใจที่ลึกซึ้งยิ่งขึ้นเกี่ยวกับพลวัตของตลาดฟอเร็กซ์ด้วยตัวชี้วัด Relative Currency Strength (RCS) ที่ครอบคลุม ซึ่งออกแบบมาเฉพาะสำหรับแพลตฟอร์ม cTrader
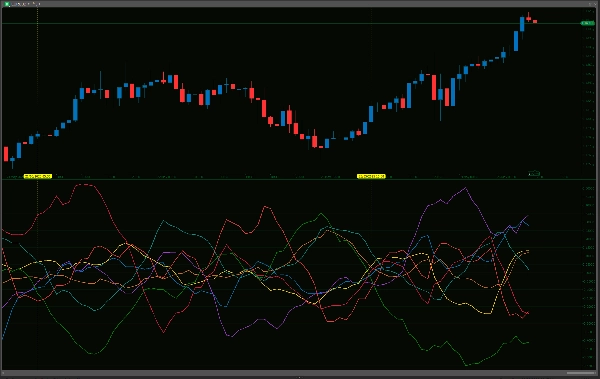
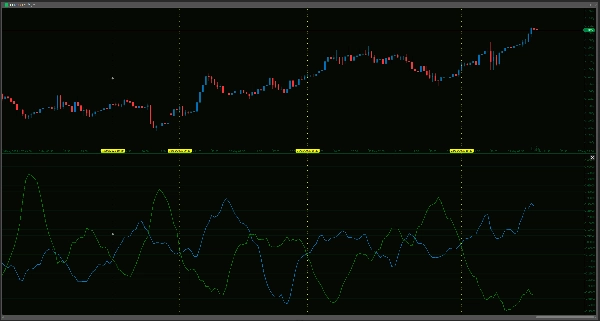
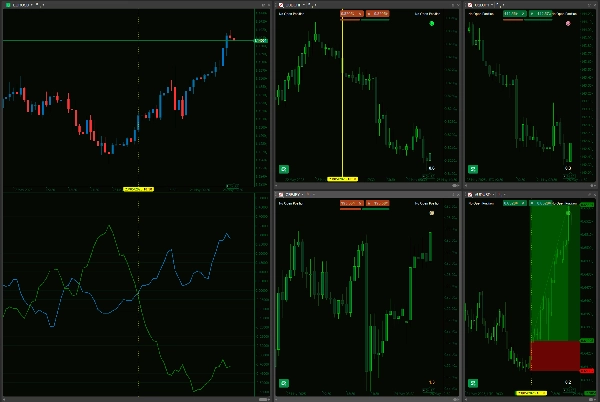
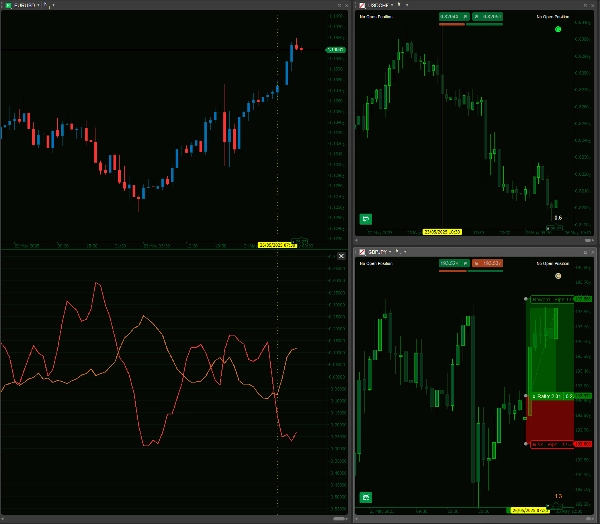
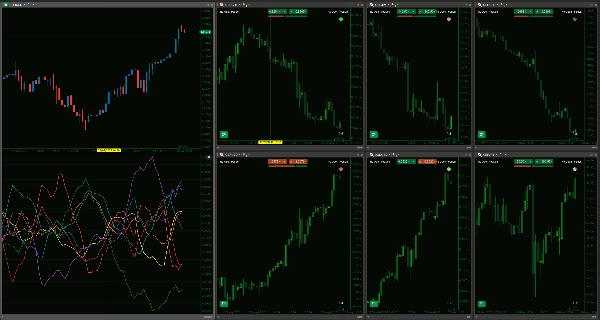
เครื่องมือที่ทรงพลังนี้ประเมินประสิทธิภาพของสกุลเงินหลักแปดสกุลอย่างละเอียด—AUD, USD, EUR, JPY, GBP, CAD, CHF และ NZD—โดยวิเคราะห์การเปลี่ยนแปลงเป็นเปอร์เซ็นต์เทียบกันในกลุ่มคู่สกุลเงิน 28 คู่ ด้วยช่วงเวลาย้อนหลังและการปรับความเรียบที่ผู้ใช้กำหนดได้ คุณสามารถปรับความไวของตัวชี้วัดให้สอดคล้องกับวิธีการเทรดเฉพาะตัวของคุณ ตั้งแต่การสแคลป์แบบรวดเร็วไปจนถึงกลยุทธ์ระยะยาว ผลลัพธ์ที่แสดงอย่างชัดเจนช่วยให้เปรียบเทียบได้ทันทีและง่ายดาย ช่วยให้คุณระบุสกุลเงินที่มีโมเมนตัมขาขึ้นแข็งแกร่งหรือสกุลเงินที่แสดงสัญญาณอ่อนแอได้อย่างรวดเร็ว ซึ่งมีประโยชน์ในการเลือกคู่สกุลเงินที่มีศักยภาพสูงสำหรับกลยุทธ์ของคุณ มันเป็นวิธีที่จะก้าวข้ามการวิเคราะห์คู่เดียวและเห็นภาพรวมที่ใหญ่ขึ้นว่าสกุลเงินใดเป็นตัวขับเคลื่อนตลาดอย่างแท้จริง
อย่างไรก็ตาม สิ่งสำคัญคือการใช้ตัวชี้วัดนี้ด้วยความเข้าใจที่ชัดเจนเกี่ยวกับความสามารถและข้อจำกัดของมัน ตัวชี้วัด RCS เป็นเครื่องมือวิเคราะห์ที่ซับซ้อน ไม่ใช่อุปกรณ์ทำนายที่ไม่มีข้อผิดพลาดหรือระบบเทรดแบบ 'ตั้งค่าแล้วลืม' อย่างสมบูรณ์ การคำนวณของมันอิงจากข้อมูลราคาย้อนหลังและมีวัตถุประสงค์เพื่อเสริม ไม่ใช่แทนที่ วิธีการเทรดที่คุณมีอยู่ ซึ่งควรประกอบด้วยการวิเคราะห์พฤติกรรมราคาที่ละเอียด การพิจารณาปัจจัยพื้นฐาน และการบริหารความเสี่ยงที่เข้มแข็ง ในขณะที่เส้นแสดงถึง 'ความแข็งแกร่ง' หรือ 'ความอ่อนแอ' การอ่านค่าเหล่านี้ต้องการการตีความอย่างรอบคอบในบริบทของตลาดโดยรวม; ตัวอย่างเช่น สกุลเงินที่แสดง 'ความแข็งแกร่ง' อย่างมากอาจกำลังเข้าใกล้สภาวะซื้อมากเกินไปหรือระดับแนวต้านสำคัญ
ประสิทธิภาพของตัวชี้วัดอาจเปลี่ยนแปลงตามสภาพตลาดที่เป็นอยู่ (เช่น อาจทำงานแตกต่างกันในตลาดที่มีแนวโน้มแรงกับตลาดที่เคลื่อนไหวแบบไซด์เวย์หรือผันผวน) และความแม่นยำขึ้นอยู่กับแพลตฟอร์มของคุณที่มีข้อมูลย้อนหลังที่เพียงพอและสะอาดสำหรับคู่สกุลเงินทั้ง 28 คู่ที่เกี่ยวข้อง แม้จะได้รับการปรับแต่งสำหรับการคำนวณอย่างต่อเนื่อง การโหลดข้อมูลเริ่มต้นสำหรับการวิเคราะห์ข้ามสกุลเงินที่ครอบคลุมเช่นนี้อาจใช้ทรัพยากรของแพลตฟอร์มมาก โดยเฉพาะอย่างยิ่งในกรณีที่เชื่อมต่อช้า หรือฮาร์ดแวร์ที่มีประสิทธิภาพต่ำ ด้วยการให้มุมมองหลายสกุลเงินที่ละเอียด ตัวชี้วัด RCS นี้จึงถูกนำเสนอเป็นเครื่องมือช่วยที่มีคุณค่าเพื่อช่วยให้คุณตัดสินใจเทรดได้อย่างมีข้อมูลและมีเหตุผลมากขึ้น และอาจช่วยเพิ่มความได้เปรียบของคุณในสนามแข่งขันฟอเร็กซ์ แทนที่จะเป็นโซลูชันแบบสแตนด์อโลน
โปรดตรวจสอบว่าโบรกเกอร์ของคุณมีคู่สกุลเงินข้ามทั้งหมดที่ใช้ในตัวชี้วัดนี้เพื่อให้มันทำงานได้
--------------------------
โปรดอย่าลังเลที่จะตรวจสอบตัวชี้วัดอื่นๆ ของฉัน!
https://ctrader.com/products/1181
https://ctrader.com/products/1182
https://ctrader.com/products/1180
https://ctrader.com/products/1015
https://ctrader.com/products/555
https://ctrader.com/products/553
https://ctrader.com/products/554
https://ctrader.com/products/552
https://ctrader.com/products/557
https://ctrader.com/products/845
https://ctrader.com/products/848
https://ctrader.com/products/847
https://ctrader.com/products/846
https://ctrader.com/products/551
https://ctrader.com/products/574
https://ctrader.com/products/573
https://ctrader.com/products/556
https://ctrader.com/products/558
https://ctrader.com/products/559
https://ctrader.com/products/560
สรุป
The indicator provides a clear visual representation of currency strength and weakness, enabling traders to identify currencies with strong momentum or signs of weakness at a glance. This multi-currency perspective helps move beyond single-pair analysis to understand which currencies are driving market movements.
The tool relies on historical price data and requires all relevant currency pairs to be available from the broker. Its performance may vary with market conditions, and it is intended to complement, not replace, comprehensive trading strategies that include price action, fundamental analysis, and risk management. Initial data loading can be resource-intensive due to the breadth of cross-currency calculations.
This indicator serves as an analytical aid to support more informed Forex trading decisions by highlighting relative currency strength across major pairs.
รีวิวจากลูกค้า
5 | 33 % | |
4 | 67 % | |
3 | 0 % | |
2 | 0 % | |
1 | 0 % |


