
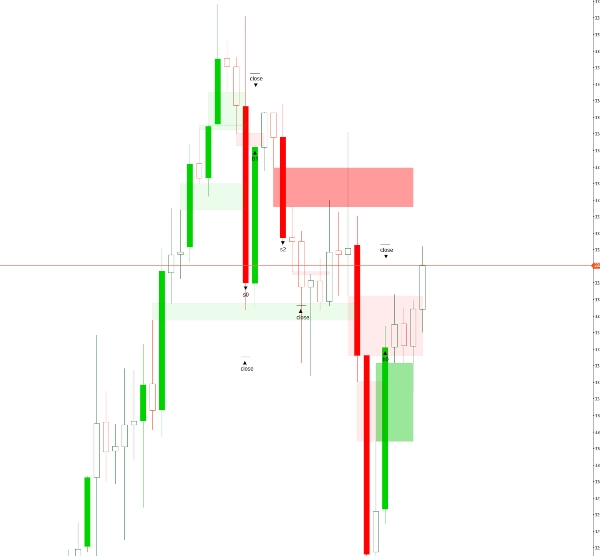
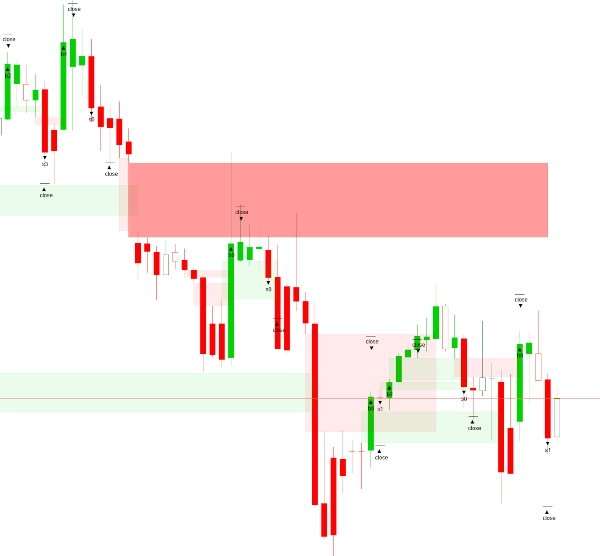
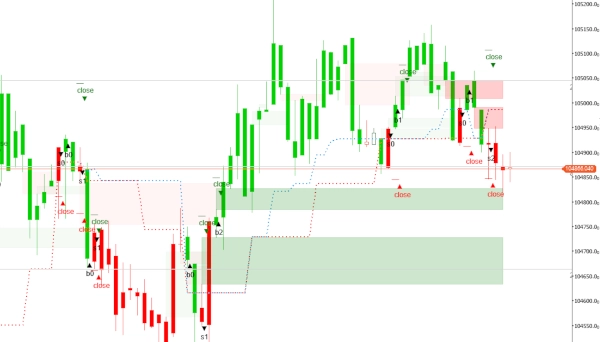
Ten wskaźnik Fair Value Gap (FVG) to narzędzie analizy technicznej zaprojektowane do wykrywania nieefektywności cenowych na rynkach finansowych. Identyfikuje obszary, w których cena gwałtownie wzrosła lub spadła, pozostawiając „lukę” — strefę z niewielką lub żadną aktywnością handlową. Te luki często sygnalizują tymczasową nierównowagę między podażą a popytem, sugerując, że cena może ostatecznie wrócić, aby „wypełnić” tę pustkę, gdy rynek dąży do równowagi. Zazwyczaj FVG jest rozpoznawany, gdy świeca cenowa zamyka się znacznie powyżej maksimum lub poniżej minimum poprzedniej świecy bez nakładania się, co wskazuje na potencjalny obszar reakcji. To zachowanie często wiąże się z handlem instytucjonalnym lub aktywnością algorytmiczną. Podczas gdy większość wersji tego wskaźnika analizuje nierównowagi na pojedynczym interwale czasowym, wersja premium dodaje wszechstronność, wykrywając i wyświetlając luki z wyższych lub niższych interwałów bezpośrednio na bieżącym wykresie, zapewniając głębszy kontekst do analizy wielointerwałowej.
Przegląd ustawień
- Liczba świec do załadowania: Określa liczbę historycznych świec do analizy, zaczynając od najnowszej zakończonej i cofając się wstecz.
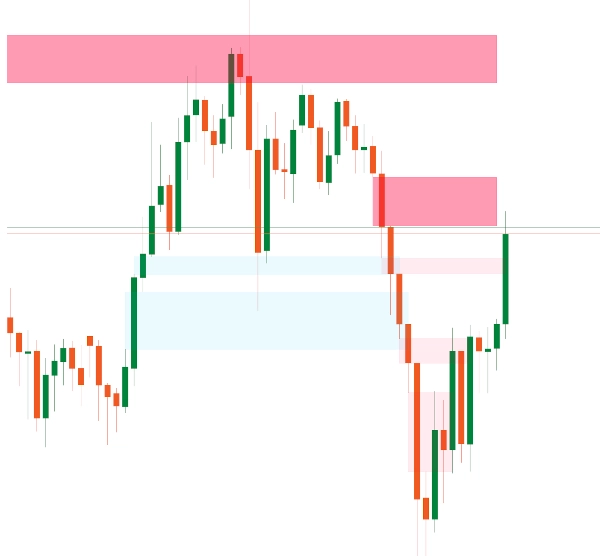
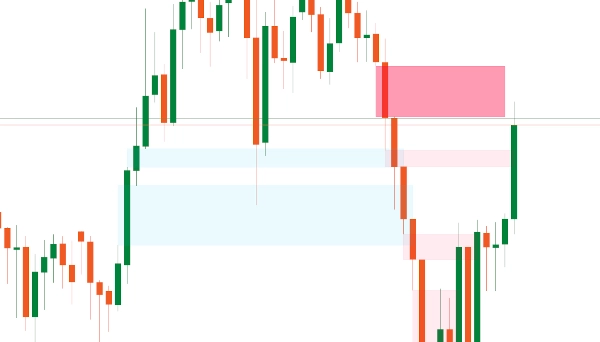
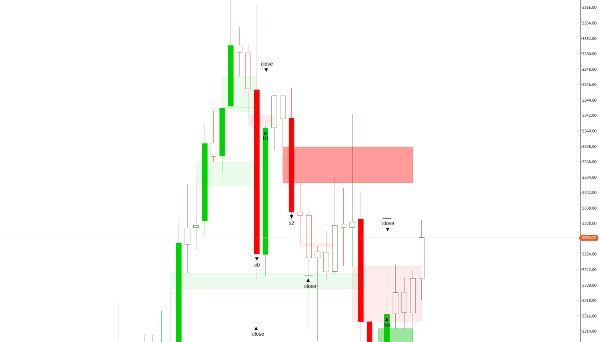
- Kolor byczego FVG: Ustawia kolor dla FVG pojawiających się w trendzie wzrostowym. Stosowana jest 30% przezroczystość, aby elementy za luką pozostały widoczne.
- Kolor niedźwiedziego FVG: Ustawia kolor dla FVG pojawiających się w trendzie spadkowym, również z 30% przezroczystością dla lepszej widoczności na wykresie.
Funkcje premium (dostępne w wersji płatnej)
- Usuwanie zamkniętych luk: Ustawienie typu Boolean — po włączeniu („tak”) automatycznie usuwa wszystkie zamknięte luki; jeśli wyłączone („nie”), luki pozostają widoczne. Jest to szczególnie przydatne na niższych interwałach czasowych (poniżej 20 minut).
- Edycja/usuwanie luk: Pozwala traderom ręcznie dostosowywać lub usuwać luki. Daje to doświadczonym traderom większą kontrolę, zwłaszcza że bardzo małe luki zazwyczaj mają niewielki wpływ na ruch ceny.
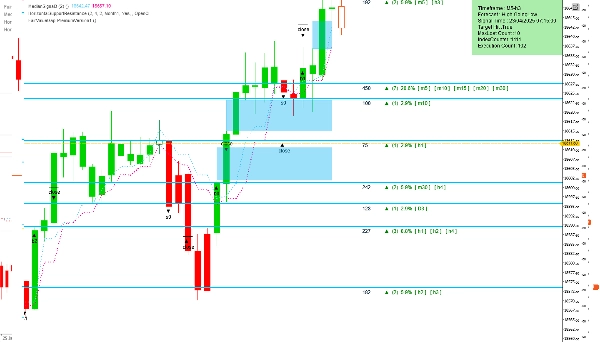
- Ustaw interwał czasowy: Oferuje dwie opcje — użycie interwału bieżącego wykresu lub wybór innego do analizy, przy jednoczesnym wyświetlaniu wyników na głównym wykresie. Ta funkcja pomaga traderom szybciej uzyskać wgląd w prawdopodobne ruchy rynku.
- Wybrany interwał czasowy: Określa pożądany interwał do analizy, jeśli w powyższym ustawieniu wybrano „Wybrany interwał czasowy”.
- Dokładność małych luk: Pozwala traderom wprowadzić preferowany rozmiar luki jako liczbę całkowitą, pomagając zidentyfikować luki, które historycznie prowadziły do korzystnych rezultatów. Wartość opiera się na całym zestawie danych i obserwowanych rozmiarach luk dla danego aktywa.
Domyślnie wskaźnik skanuje wszystkie nierównowagi w pojedynczym interwale czasowym. Jednak dostęp do funkcji premium poprzez FairValueGapPremium może znacznie zwiększyć możliwości analityczne.
5 | 100 % | |
4 | 0 % | |
3 | 0 % | |
2 | 0 % | |
1 | 0 % |


