present
ลงทะเบียนและรับส่วนลด $50 สำหรับการซื้อครั้งแรกของคุณ
Trading product for Impulse Heatmap อินดิเคเตอร์ EMA Key Levels, image 1
Impulse Heatmap
อินดิเคเตอร์
เวอร์ชัน 1.0, Aug 2026
Windows, Mac
Trading product for Impulse Heatmap อินดิเคเตอร์ EMA Key Levels, image 2
Trading product for Impulse Heatmap อินดิเคเตอร์ EMA Key Levels, image 3
Trading product for Impulse Heatmap อินดิเคเตอร์ EMA Key Levels, image 4
Trading product for Impulse Heatmap อินดิเคเตอร์ EMA Key Levels, image 5
ตั้งแต่ 07/05/2026
5
การขาย
63
ติดตั้งฟรี

คำอธิบาย

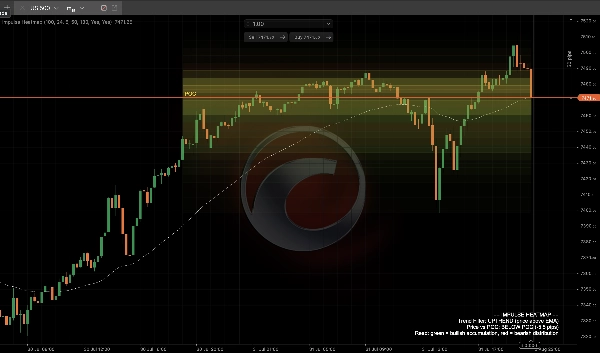
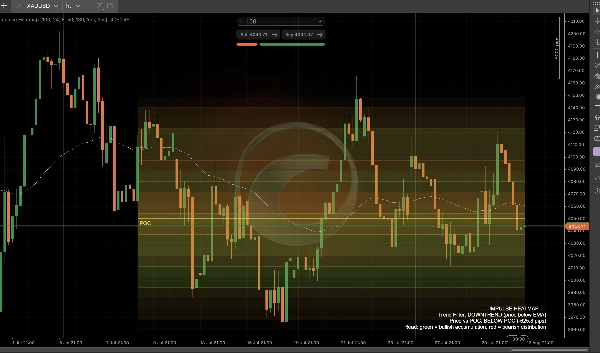
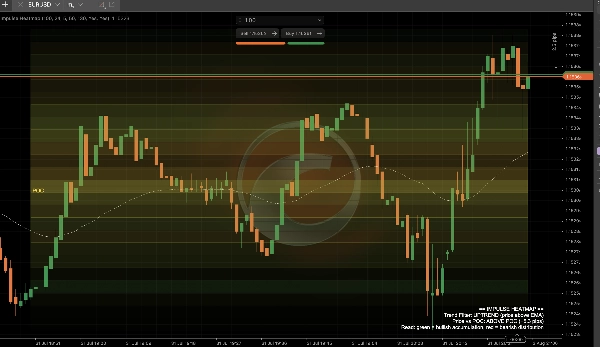
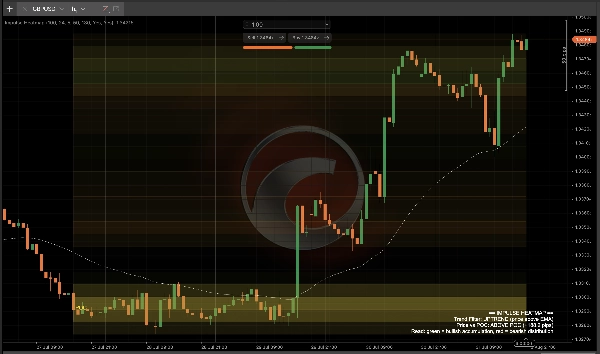
แผนที่ความร้อนของปริมาณมีอยู่ทั่วไปในตอนนี้ แต่เกือบทั้งหมดแสดงสิ่งเดียวกัน: ความเข้มข้นเท่านั้น สีเดียว ไม่มีความรู้สึกว่า ปริมาณนั้นเป็นการซื้อหรือขาย Impulse Heatmap เพิ่มชิ้นส่วนที่ขาดหายไป — ทุกโซนราคาจะผสมสีโดย ทิศทาง ไม่ใช่แค่ความหนาแน่น ดังนั้นคุณจึงสามารถบอกความแตกต่างระหว่างการสะสมกับการกระจายได้ในทันที

สิ่งที่มันวิเคราะห์: ปริมาณแท็กในช่วงเวลาย้อนหลังแบบเลื่อนที่กระจายเป็นถังราคาด้วยวิธีเดียวกับโปรไฟล์ปริมาณมาตรฐาน — ยกเว้นว่าสีของแต่ละถังเป็นการผสมผสานของปริมาณที่มาจากแท่งเทียนปิดบวกและแท่งเทียนปิดลบที่ราคานั้น โซนที่มีปริมาณบวกส่วนใหญ่จะเรืองแสงเป็นสีเขียว (การสะสม); โซนที่มีปริมาณลบส่วนใหญ่จะเรืองแสงเป็นสีแดง (การกระจาย); โซนผสมจะอยู่ระหว่างกลาง

วิธีอ่าน:

  • โซนที่สว่างและอิ่มตัว = ความเข้มข้นของปริมาณสูง — นี่คือระดับราคาที่ตลาดใช้เวลามากที่สุดและมีขนาดมากที่สุด
  • โซนที่มีสีเขียว = ระดับราคานั้นสร้างขึ้นส่วนใหญ่จากแรงกดดันบวก — พื้นที่สนับสนุน/สะสมที่เป็นไปได้
  • โซนที่มีสีแดง = ระดับราคานั้นสร้างขึ้นส่วนใหญ่จากแรงกดดันลบ — พื้นที่ต้านทาน/กระจายที่เป็นไปได้
  • เส้น POC สีทอง ติดตามจุดศูนย์ถ่วงของปริมาณที่เรียบเนียน — ที่ซึ่ง "มูลค่ายุติธรรม" ที่แท้จริงตั้งอยู่ในขณะนี้ โดยไม่มีความกระตุกของการคำนวณจุดควบคุมดิบ
  • ตัวกรองแนวโน้ม EMA สีขาว ให้บริบทแก่คุณ: โซนความร้อนปัจจุบันสนับสนุนแนวโน้มที่มีอยู่หรือกำลังต่อต้าน?
  • แผง HUD สดแจ้งสถานะแนวโน้มและระยะห่างของราคาจาก POC เป็นพิปอย่างแม่นยำ

การตั้งค่าหลัก: ความยาวหน้าต่างย้อนกลับ จำนวนถังราคา (ความละเอียด) การปรับเรียบ POC ระยะเวลาตัวกรองแนวโน้ม EMA และการปรับแต่งสีเต็มรูปแบบสำหรับการผสมสีบวก/ลบและเส้น POC

กรณีการใช้งานทั่วไป: การตรวจสอบว่าโซนสนับสนุน/ต้านทานถูกสร้างขึ้นจากแรงซื้อหรือแรงขายจริงหรือไม่ แทนที่จะเป็นแค่ปริมาณดิบ; การใช้ POC เป็นแม่เหล็กมูลค่ายุติธรรมแบบไดนามิก; การยืนยันว่าปริมาณที่ระดับปัจจุบันสอดคล้องหรือขัดแย้งกับแนวโน้มที่มีอยู่; การรวมกับโมเดลเข้าของคุณเองเป็นตัวกรองบริบทปริมาณ

เหมาะสำหรับ: เทรดเดอร์รายวันในฟอเร็กซ์หลัก ทองคำ และดัชนีที่ต้องการมากกว่าบาร์ปริมาณแบนหรือแผนที่ความร้อนสีเดียว — มีประโยชน์ทั้งในฐานะการอ่านเดี่ยวหรือเป็นการยืนยันร่วมกับการตั้งค่าที่อิงโครงสร้าง

สรุป

สรุปโดย AI
Impulse Heatmap is a directional volume heatmap indicator designed to analyze tick volume distribution across price zones with a focus on volume direction—buying versus selling—rather than just volume intensity. It segments volume into price bins similar to a volume profile but colors each bin based on the proportion of bullish-closing versus bearish-closing candle volume. Zones with predominantly bullish volume appear green, indicating accumulation or potential support, while zones with mostly bearish volume appear red, indicating distribution or potential resistance. Mixed zones show blended colors.

Key features include:
- Bright, saturated zones highlighting high volume concentration price levels.
- A gold Point of Control (POC) line representing a smoothed volume center of gravity as a dynamic fair value reference.
- A white trend filter EMA providing context on whether volume zones align with or oppose the prevailing trend.
- A live HUD panel displaying trend state and price distance from the POC in pips.
- Customizable settings for lookback window, price bin resolution, POC smoothing, trend filter EMA period, and color schemes.

Impulse Heatmap is suited for intraday traders focusing on forex majors, gold, and indices who require enhanced volume context to distinguish genuine buying or selling pressure at key support and resistance levels. It can be used standalone or combined with other structural or entry models.
โปรไฟล์อินดิเคเตอร์
หมวดหมู่อินดิเคเตอร์
Trend
ประเภทเอาต์พุต
สัญญาณ
การแสดงเป็นภาพ
ข้อกำหนดด้านข้อมูล
แท่งเท่านั้น
ข้อมูล Tick
สัญญาณที่รองรับ
Breakout
Reversal
ความแข็งแกร่งของแนวโน้ม
ความผันผวน
Range ณ เวลาที่เปิดเซสชัน
Divergence

รีวิวจากลูกค้า

0.0
รีวิว: 0
รีวิวจากลูกค้า
ยังไม่มีรีวิวสำหรับผลิตภัณฑ์นี้ หากเคยลองแล้ว ขอเชิญมาเป็นคนแรกที่บอกคนอื่น!

การสนทนา

คำถามที่พบบ่อย

EMA
Key Levels
AI-assisted
BOS
Volume
Market Structure
Support & Resistance
ผลิตภัณฑ์ที่มีให้บริการผ่าน cTrader Store รวมถึงบอทการเทรด อินดิเคเตอร์ และปลั๊กอิน มีให้บริการโดยนักพัฒนาบุคคลที่สามและมีไว้เพื่อวัตถุประสงค์ในการเข้าถึงข้อมูลและทางเทคนิคเท่านั้น cTrader Store ไม่ใช่โบรกเกอร์และไม่ได้ให้คำแนะนำการลงทุน คำแนะนำส่วนบุคคล หรือการรับประกันผลการดำเนินงานในอนาคต

เพิ่มเติมจากผู้เขียนคนนี้

ปลั๊กอินหลายแพลตฟอร์ม
News Filter
Risk Alerts
+5
Smart Money Concepts and ICT Trading Analytics Platform. Daily bias estimator, ICT strategty checker, TP and SL.
อินดิเคเตอร์
AI-assisted
Order Block
+5
The daily bias estimator indicator uses ICT concepts to show whether the chart is bullish or bearish on multi-time frame
อินดิเคเตอร์
ATR
BOS
+5
Full ICT/SMC 4-step setup checker that alerts a long or short setup.
อินดิเคเตอร์
Volume
Fibonacci
+5
Classic 9:30 Opening Range Breakout — auto-plots the range, flags volume-confirmed breakouts long or short, live.
อินดิเคเตอร์
Flag
VWAP
+5
Session VWAP with statistical deviation bands, gradient cloud, and live rejection alerts — see exactly how stretched pri
อินดิเคเตอร์
MSS
AI-assisted
+5
Live ICT Silver Bullet detection: liquidity sweeps, structure shifts, and killzone-gated FVGs, graded and glowing in rea
อินดิเคเตอร์
ATR
Key Levels
+5
CPR indicator that actually predicts the day ahead: width percentile scoring for breakout-day detection
อินดิเคเตอร์
Triangle
Double Top
+5
Know which liquidity sweeps are real. Auto-tracks EQH/EQL and confirms genuine reversals, not just broken levels.
อินดิเคเตอร์
ATR
MSS
+5
Grades ICT Unicorn setups (Breaker Block + FVG confluence) into PRIME / SETUP / WATCH, with retest & RR targets.
อินดิเคเตอร์
BOS
Volume
+5
20/40/60-day IPDA lookback ranges, Premium/Discount/Equilibrium zones, and quarterly shift alerts — anchored to true dai
อินดิเคเตอร์
BOS
MSS
+5
One indicator, full ICT/SMC picture — structure, OBs, FVGs, liquidity, Premium/Discount — with graded PRIME/SETUP signal

นอกจากนี้คุณยังอาจชอบ

"Zigzag Trend" โลโก้
เรตติ้งสูง
4.5
(4)
$25
/
$45
อินดิเคเตอร์
AI
ATR
+23
The ZigZag Trend is a market structure tool that filters out small price fluctuations and highlights major swing.
อินดิเคเตอร์
VWAP
Forex
+12
Unlock VWAP in cTrader! Choose anchor periods, price sources, and display deviation bands with real-time tick updates.
"Candles_Painter" โลโก้
ยอดนิยม
4.6
(3)
$19
อินดิเคเตอร์
Overlay HTF context on any chart: color bars by HTF and draw filled HTF bodies with optional High/Low lines.
อินดิเคเตอร์
ATR
SMC
+2
Auto Fibonacci Retracement Pro – Smart Swing & Golden Zone Levels
อินดิเคเตอร์
BOS
Volume
+5
20/40/60-day IPDA lookback ranges, Premium/Discount/Equilibrium zones, and quarterly shift alerts — anchored to true dai
อินดิเคเตอร์
XAUUSD
Professional Volume Profile Indicator - Shows volume distribution, POC, Value Areas & Buy/Sell pressure.
อินดิเคเตอร์
Signal
Cumulative Volume Delta tracks the net difference in tick volume between buying and selling pressure over time
อินดิเคเตอร์
ATR
Channel
Reversal Trap Probability Bands plots a dynamic volatility envelope around price & automatically detects "trap" reversal
"Perfect Trend" โลโก้
ยอดนิยม
4.5
(4)
$25
อินดิเคเตอร์
Forex
Crypto
+3
Perfect Trend
อินดิเคเตอร์
AI
ATR
+27
An advanced VWAP with multi-VWAP (Daily/Weekly/Monthly/Anchored), click-to-anchor, configurable alerts, a stats panel,
อินดิเคเตอร์
Prop
Forex
+5
Higher TimeFrame Candle Tracker: Current Timeframe (Any TimeFrame) Show High TimeFrame Candle Bar
"RSI Advanced" โลโก้
เรตติ้งสูง
5.0
(4)
$20
/
$30
อินดิเคเตอร์
AI
ATR
+12
The standard Relative Strength Index (RSI), RSI & Signal Cloud, Smart Volatility Filter (ATR), On-Chart Info Dashboard
"HMA MTF 2.0" โลโก้
ยอดนิยม
4.2
(4)
$20
/
$40
อินดิเคเตอร์
Prop
Forex
+4
HMA MTF 2.0 (Multi-Timeframe )
"SSL Channel" โลโก้
ยอดนิยม
4.5
(4)
$19
/
$20
อินดิเคเตอร์
Forex
BTCUSD
+10
Trend-following channel using dual MAs with visual cloud and optional alerts on crossovers
อินดิเคเตอร์
BOS
MSS
+3
Advanced indicator to highlight key execution context and help aligning structure, location, and risk.
"LT Flexible Volume Profile" โลโก้
ยอดนิยม
5.0
(3)
$19
อินดิเคเตอร์
Forex
Flexible Volume Profile, designed with performance in mind.
อินดิเคเตอร์
RSI
Key Levels
+3
MARCs Multi-timeframe market dashboard with trend rows, RSI context, sessions, presets and optional chart levels.
"LT_Ind_Candles" โลโก้
ยอดนิยม
4.0
(2)
$19
อินดิเคเตอร์
ATR
Forex
+5
Most used candle patterns. (1 candle, 2 candles and 3 candles patterns) and Marubozu. Bonus Fibo Risk control.

ราคา

ตั้งแต่ 07/05/2026
5
การขาย
63
ติดตั้งฟรี