
session indicator
อินดิเคเตอร์
7 การซื้อ
เวอร์ชัน 1.0, May 2025
Windows, Mac
4.3
รีวิว: 3
คำอธิบาย
มองเห็นช่วงเวลาตลาดหลัก + ระดับสูง/ต่ำอย่างแม่นยำ
ตัวบ่งชี้ช่วงเวลาการซื้อขายเน้นช่วงเวลาการซื้อขายที่สำคัญที่สุด — ลอนดอน, นิวยอร์ก, และ โตเกียว — โดยตรงบนแผนภูมิของคุณ ไม่ว่าคุณจะเป็นนักเก็งกำไรระยะสั้นหรือเทรดเดอร์สวิง การรู้ว่าเมื่อใดที่ความผันผวนเพิ่มขึ้นหรือลดลงเป็นสิ่งสำคัญ เครื่องมือนี้ให้ความได้เปรียบดังกล่าวอย่างชัดเจน
✅ คุณสมบัติหลัก:
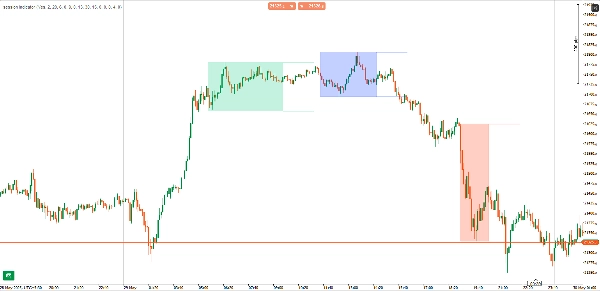
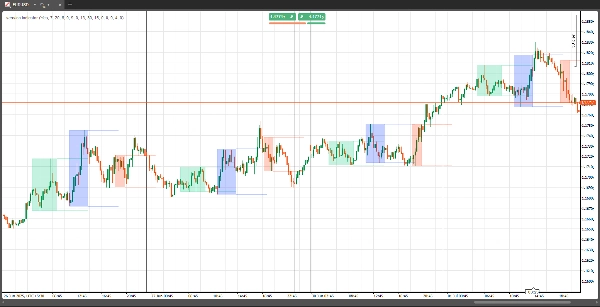
- สี่เหลี่ยมช่วงเวลา: เน้นแต่ละช่วงเวลาอย่างชัดเจนด้วยกล่องที่มีเงาเป็นทางเลือก
- เส้นสูง/ต่ำ: วางจุดสูงสุดและต่ำสุดของช่วงเวลาด้วย ความยาวขยายที่ปรับแต่งได้
- มุมมองประวัติศาสตร์: ดูข้อมูลช่วงเวลาของวันปัจจุบันหรือจำนวน วันที่ผ่านมา
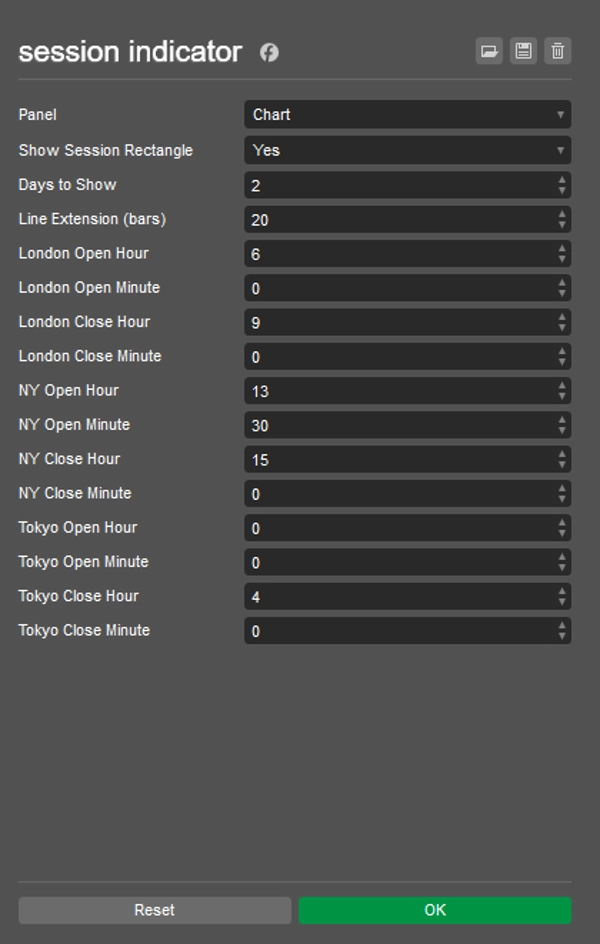
- ปรับแต่งได้เต็มที่: กำหนดเวลาการเริ่มต้น/สิ้นสุดช่วงเวลา เปิด/ปิดสี่เหลี่ยม และกำหนดระยะการขยายของเส้น
- รองรับหลายกรอบเวลา: ใช้งานได้กับทุกกรอบเวลาของแผนภูมิ
🔧 พารามิเตอร์:
- เวลาช่วงเวลา: กำหนดเวลาเริ่มต้น/สิ้นสุดสำหรับลอนดอน, นิวยอร์ก, และโตเกียว
- แสดงสี่เหลี่ยม: เปิด/ปิดกล่องเงาช่วงเวลา
- จำนวนวันที่แสดง: จำนวนวันที่ประวัติศาสตร์ที่จะแสดงข้อมูลช่วงเวลา
- จำนวนแท่งขยายเส้น: ควบคุมระยะการขยายของเส้นสูง/ต่ำของช่วงเวลาบนแผนภูมิ
🧠 ทำไมต้องใช้?
การเข้าใจรูปแบบความผันผวนตามช่วงเวลาเป็นหัวใจสำคัญของการซื้อขายสถาบัน ตัวบ่งชี้นี้ช่วยให้คุณ:
- กำหนดเวลาการเข้าและออกรอบ โซนสภาพคล่องหลัก
- ระบุ จุดสูงและต่ำของช่วงเวลา สำหรับกลยุทธ์เบรกเอาต์หรือกลับตัว
- แยกแยะ ช่วงเวลาที่ทับซ้อนกันอย่างชัดเจน (เช่น ลอนดอน–นิวยอร์ก)
สรุป
สรุปโดย AI
The Session Indicator is a charting tool designed to highlight key global trading sessions—London, New York, and Tokyo—directly on trading charts. It visually marks each session with optional shaded rectangles and plots session high and low price levels, with customizable line extension lengths. Users can view session data for the current day or multiple previous days, supporting analysis across various timeframes.
Key features include full customization of session start and end times, toggling of session rectangles, and control over how far high/low lines extend. The indicator works on all chart timeframes and helps traders identify volatility patterns associated with institutional trading sessions.
This tool aids in timing entries and exits around key liquidity zones, recognizing session highs and lows for breakout or reversal strategies, and visually distinguishing overlapping sessions such as London-New York. It supports markets including Forex, indices, and major symbols like NAS100. The indicator outputs visual signals based on market structure concepts and is suitable for traders employing reversal strategies.
โปรไฟล์อินดิเคเตอร์
หมวดหมู่อินดิเคเตอร์
โครงสร้างตลาด (SMC)
ประเภทเอาต์พุต
การแสดงเป็นภาพ
ข้อกำหนดด้านข้อมูล
แท่งเท่านั้น
สัญญาณที่รองรับ
Reversal
รีวิวจากลูกค้า
4.3
รีวิว: 3
5 | 67 % | |
4 | 0 % | |
3 | 33 % | |
2 | 0 % | |
1 | 0 % |
รีวิวจากลูกค้า
June 2, 2025
Useful setup helper for traders who care about timing windows. It gives value around session timing, but the value depends on the trader's schedule. I would compare Asia range, London break and New York continuation before trusting it. The tool is most useful when it keeps the trader out of dead hours.
June 1, 2025
June 1, 2025
Decent trade support for session timing. it helps match setups with active market hours, especially when used for planning trades around active sessions. The session view is useful for London and New York, especially when checking the first 60 minutes. The tool is most useful when it keeps the trader out of dead hours.
การสนทนา
คำถามที่พบบ่อย
Prop
Forex
Indices
Fair Value Gap
SMC
NAS100
ผลิตภัณฑ์ที่มีให้บริการผ่าน cTrader Store รวมถึงบอทการเทรด อินดิเคเตอร์ และปลั๊กอิน มีให้บริการโดยนักพัฒนาบุคคลที่สามและมีไว้เพื่อวัตถุประสงค์ในการเข้าถึงข้อมูลและทางเทคนิคเท่านั้น cTrader Store ไม่ใช่โบรกเกอร์และไม่ได้ให้คำแนะนำการลงทุน คำแนะนำส่วนบุคคล หรือการรับประกันผลการดำเนินงานในอนาคต


ราคา
ตั้งแต่ 30/05/2025
40
การขาย