
supertrend
อินดิเคเตอร์
5 การซื้อ
เวอร์ชัน 1.0, May 2025
Windows, Mac
4.3
รีวิว: 3
คำอธิบาย
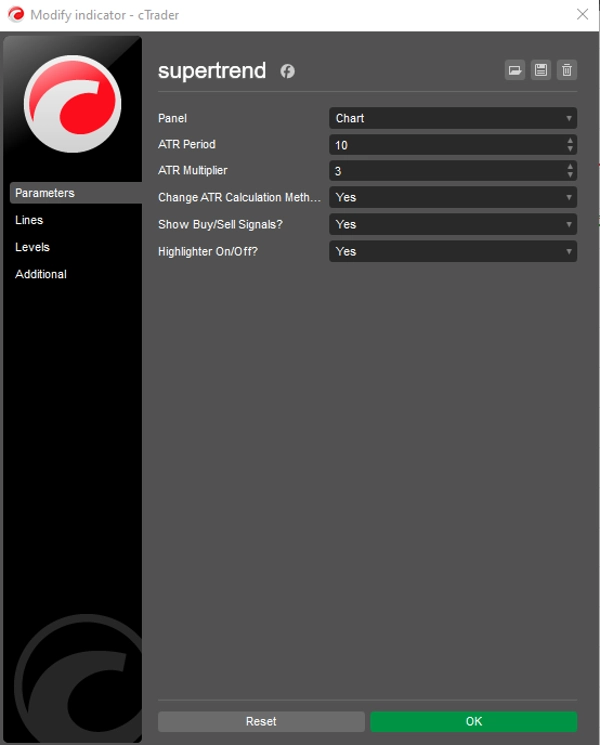
ตัวบ่งชี้ Supertrend สำหรับ cTrader
ตัวบ่งชี้ Supertrend เป็นเครื่องมือที่ทรงพลังและหลากหลายสำหรับติดตามแนวโน้มที่ออกแบบมาเพื่อช่วยเทรดเดอร์ระบุแนวโน้มตลาดและจุดเข้า/ออกที่เป็นไปได้อย่างง่ายดาย สร้างขึ้นสำหรับแพลตฟอร์ม cTrader ตัวบ่งชี้นี้ใช้ Average True Range (ATR) เพื่อคำนวณระดับแนวรับและแนวต้านแบบไดนามิก ให้สัญญาณภาพที่ชัดเจนสำหรับแนวโน้มขาขึ้นและขาลง ความเรียบง่ายและประสิทธิภาพของมันทำให้เป็นที่ชื่นชอบในหมู่เทรดเดอร์ทุกระดับประสบการณ์ ตั้งแต่สแคปเปอร์ไปจนถึงนักลงทุนระยะยาว
สรุป
สรุปโดย AI
The Supertrend Indicator for cTrader is a trend-following tool that helps traders identify market trends and potential entry and exit points. It uses the Average True Range (ATR) to calculate dynamic support and resistance levels, providing clear visual signals for bullish and bearish trends. Designed for use on the cTrader platform, this indicator supports markets including Forex and indices. Its straightforward design makes it suitable for traders of various styles and experience levels, from scalpers to long-term investors. The indicator outputs trend strength signals based on bar data, aiding in market analysis without opening positions automatically.
โปรไฟล์อินดิเคเตอร์
หมวดหมู่อินดิเคเตอร์
Trend
ประเภทเอาต์พุต
สัญญาณ
ข้อกำหนดด้านข้อมูล
แท่งเท่านั้น
สัญญาณที่รองรับ
ความแข็งแกร่งของแนวโน้ม
รีวิวจากลูกค้า
4.3
รีวิว: 3
5 | 67 % | |
4 | 0 % | |
3 | 33 % | |
2 | 0 % | |
1 | 0 % |
รีวิวจากลูกค้า
June 3, 2025
Practical entry check for traders who prefer directional setups. It gives value around trend filtering, but sideways markets can weaken the signal. The signal feels safer when trend strength is clear and DD stays under 3 percent. It is a filter for bias, not a reason to ignore risk.
June 2, 2025
June 2, 2025
Clean confirmation helper for trend filtering. it helps keep attention on the broader move, especially when used for filtering out random countertrend ideas. I would judge the trend read across 3 sessions, with at least 2 higher timeframe candles agreeing. It is a filter for bias, not a reason to ignore risk.
การสนทนา
คำถามที่พบบ่อย
Prop
Forex
Signal
Indices
Supertrend
ATR
ผลิตภัณฑ์ที่มีให้บริการผ่าน cTrader Store รวมถึงบอทการเทรด อินดิเคเตอร์ และปลั๊กอิน มีให้บริการโดยนักพัฒนาบุคคลที่สามและมีไว้เพื่อวัตถุประสงค์ในการเข้าถึงข้อมูลและทางเทคนิคเท่านั้น cTrader Store ไม่ใช่โบรกเกอร์และไม่ได้ให้คำแนะนำการลงทุน คำแนะนำส่วนบุคคล หรือการรับประกันผลการดำเนินงานในอนาคต


!["[CB] Pivot Points Pro" โลโก้](https://cdn.ctrader.com/image/webp/43463c82-67b0-4f10-a4ba-901bba091d81_32594)


ราคา
ตั้งแต่ 30/05/2025
40
การขาย