
Descrição
A melhor forma de pensar no Índice Composto aplicado ao RSI é pensar no RSI como o Windows 3.0 e no Índice Composto como o Windows 10. Constance Brown descobriu que o RSI, embora crie e detecte divergências, não é tão preciso quanto poderia ser. É um pouco um paradoxo dizer isso, mas o RSI é um indicador de momentum sem nenhum cálculo de momentum associado a ele. O RSI perde uma quantidade significativa de movimentos importantes e até gera alguns movimentos ruins. O que Constance Brown fez com o RSI foi inserir um cálculo de momentum dentro do próprio RSI. Este índice remove as restrições do intervalo de normalização no RSI. Isso significa que ele não está limitado ao intervalo de 0-100.
O RSI e o Índice Composto Juntos
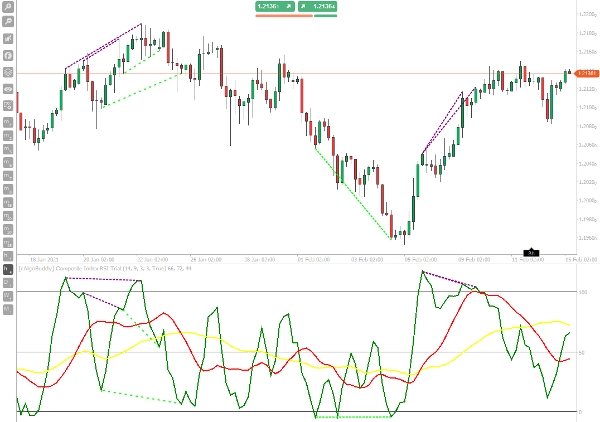
Uma das estratégias que Constance Brown empregou com o Índice Composto foi comparar o Índice Composto com o RSI. Quando procuramos divergências, procuramos coisas como divergência de alta. Uma divergência de alta ocorre quando o preço cria máximas mais altas, mas o oscilador mostra máximas mais baixas. Quando usamos o RSI e o Índice Composto juntos, tratamos o RSI como trataríamos um gráfico de preços e o Índice Composto é o oscilador.
O indicador possui uma linha interna normal do RSI para detectar divergências, então o trabalho já foi feito para você. Negocie os sinais de divergência como faria com qualquer outro oscilador.
A principal característica do Índice Composto é representar o momentum com sinais operacionais claros. Assim, quando o RSI entra em uma zona de sobrecompra ou sobrevenda, o cruzamento do Índice Composto com suas médias móveis na direção oposta representa um bom sinal de negociação, então, enquadrando essa simbiose do momentum do oscilador com a ação do preço em suportes e resistências, você obtém uma lógica de negociação muito interessante e vencedora, que também é bem adequada para negociar com criptomoedas.
Como Usar
A Estratégia do Índice Composto é uma estratégia de ação de preço baseada em momentum, baseada em uma combinação de níveis de suporte e resistência com os níveis de sobrecompra e sobrevenda do Índice de Força Relativa e do Índice Composto. O Índice Composto nesta estratégia de negociação é também o momento final de entrada.
Intervalo de Tempo: H1+, Sempre use isso com RSI.
Comprar
- O preço rebate no suporte.
- As Médias Móveis do RSI Composto estão abaixo do nível 50 e a MA rápida (Vermelha) está abaixo da MA lenta (amarela).
- O RSI cria uma mínima e o valor está próximo ou abaixo de 30 e também o Índice Composto tem uma mínima.
- Entramos comprado no momento em que o Índice Composto cruza para cima as médias móveis.
Vender
- O preço rebate na resistência.
- As Médias Móveis Compostas estão acima do nível 50 e a MA rápida (Vermelha) está acima da MA lenta (amarela)
- O RSI tem um pico e o valor está próximo ou acima de 70 e também o Índice Composto tem um pico.
- Entramos vendido quando o Índice Composto cruza para baixo as médias móveis (este é o momento para entrada no mercado).
Resumo
Avaliações de clientes
5 | 0 % | |
4 | 100 % | |
3 | 0 % | |
2 | 0 % | |
1 | 0 % |


![Logótipo de "[Stellar Strategies] Inside Bar with Signals"](https://cdn.ctrader.com/image/webp/1d9e8bfa-3b2c-4440-bb37-5856902008a7_30683)


