
Beschreibung
Überblick
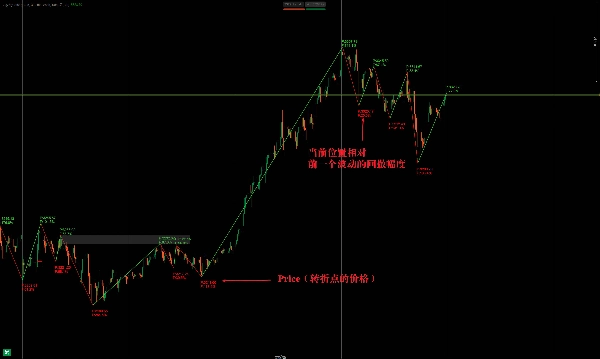
Der ZigZag Indikator ist ein Werkzeug der technischen Analyse, das hauptsächlich verwendet wird, um wichtige Preiswendepunkte zu identifizieren, indem Marktrauschen herausgefiltert wird. Er verbindet signifikante Hoch- und Tiefpunkte mit ZigZag-Linien, was Händlern hilft, Trends und potenzielle Ausbrüche zu visualisieren.
Wie ZigZag funktioniert
- Kernfunktionalität
-
- Es eliminiert kleine Preisschwankungen, indem es eine Mindestpreisänderungsschwelle (Prozentsatz oder fester Wert) festlegt.
- Verbindet nur bedeutende Swing-Hochs/-Tiefs, was die Trendanalyse vereinfacht.
- Wird häufig verwendet, um Unterstützungs-/Widerstandsniveaus, Umkehrungen (z. B. Kopf & Schultern, Doppelspitzen/-böden) zu erkennen.
- Wichtige Parameter
-
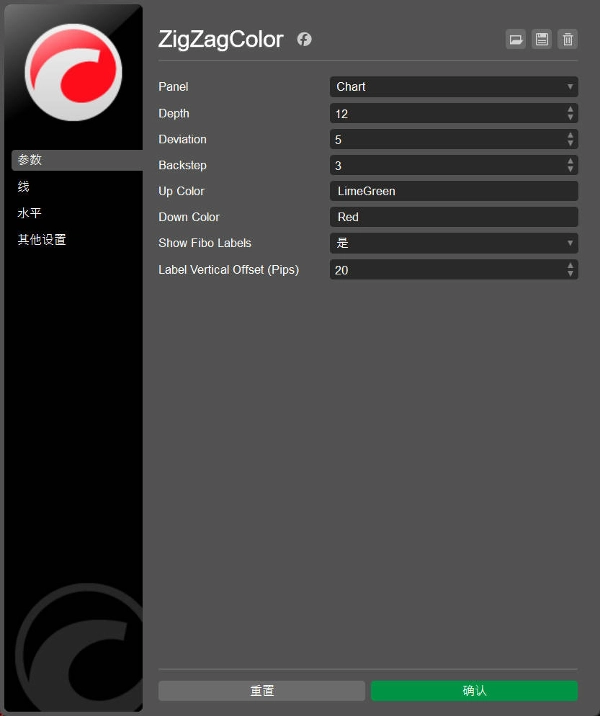
- Minimale Preisbewegung (%): Bestimmt die Empfindlichkeit (z. B. ignoriert 5 % Bewegungen, die kleiner sind).
- Lookback-Tiefe: Steuert, wie viele vergangene Kerzen analysiert werden, was die Verzögerung beeinflusst.
Hauptanwendungen
1. Trendidentifikation
- Aufwärtstrends: Höhere Hochs (HH) + höhere Tiefs (HL).
- Abwärtstrends: Niedrigere Hochs (LH) + niedrigere Tiefs (LL).
- Hilft beim Zeichnen von Trendlinien für potenzielle Ausbruchstrades.
2. Mustererkennung
- Zeigt klassische Chartmuster (Dreiecke, Flaggen, Keile) durch Definition von Swing-Punkten.
3. Fibonacci-Retracement-Level
- Markiert klare Swing-Hochs/-Tiefs für Fibonacci-Erweiterungen oder Retracements.
4. Divergenzerkennung
- Hebt Divergenzen zwischen Preis und Oszillatoren (RSI, MACD) hervor.
Der ZigZag Indikator ist ein Werkzeug der technischen Analyse, das hauptsächlich dazu dient, wichtige Wendepunkte im Preistrend zu erkennen, Händlern hilft, Marktrauschen herauszufiltern und wichtige Hoch- und Tiefpunkte hervorhebt. Im Folgenden sind die Kernpunkte und die Anwendung beschrieben:
Funktionsweise des ZigZag
- Grundlegende Funktionen:
-
- Durch Festlegung eines Schwellenwerts für Preisbewegungen (Prozentsatz oder fester Wert) werden kleine Schwankungen automatisch ignoriert und nur signifikante Hoch- und Tiefpunkte verbunden, wodurch eine ZigZag-Linie entsteht.
- Wird häufig zur Unterstützung bei der Identifikation von Unterstützungs-/Widerstandsniveaus und Trendwenden (z. B. Kopf-Schulter-Formationen, Doppelböden) verwendet.
- Wichtige Parameter:
-
- Minimale Schwankungsgröße (z. B. 5 % oder Punkte): Bestimmt die Empfindlichkeit gegenüber kleinen Schwankungen. Je größer der Wert, desto weniger, aber zuverlässigere Signale.
- Lookback-Tiefe: Steuert die Anzahl der Kerzen, die bei der Berechnung berücksichtigt werden, was die Verzögerung der Wendepunkte beeinflusst.
Hauptanwendungen
- Trenderkennung:
-
- Bestimmung der Trendrichtung durch aufeinanderfolgende höhere Hochs (Aufwärtstrend) oder niedrigere Tiefs (Abwärtstrend).
- In Kombination mit Trendlinien kann ein Ausbruch oder eine Korrektur frühzeitig prognostiziert werden.
- Musteranalyse:
-
- Erkennung klassischer Preisformationen (z. B. Dreiecke, Flaggen), wobei die ZigZag-Linien die Formationsgrenzen klar darstellen.
- Kombination mit Fibonacci-Werkzeugen:
-
- Verwendung der von ZigZag markierten Swing-Hochs/-Tiefs als Start- oder Endpunkte für Fibonacci-Retracements oder -Erweiterungen.
- Divergenzerkennung:
-
- Hilft bei der Bestätigung von Divergenzen zwischen Preis und Indikatoren (wie RSI, MACD) durch Markierung der Anfangs- und Endpunkte der Divergenzphasen.


