
AlgoCorner McGinley Dynamic
مؤشر
60 التنزيلات
الإصدار 1.1، Jan 2026
Windows, Mac
الوصف
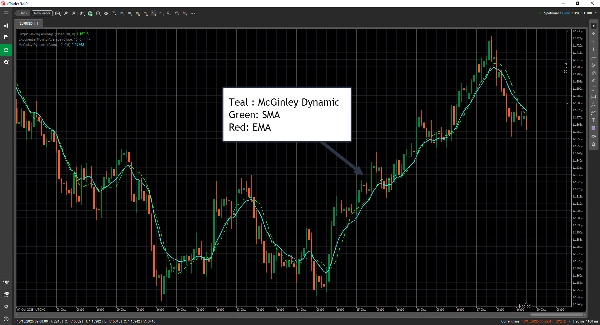
McGinley Dynamic هو أحد تلك الأدوات التقنية التي لا تحظى بالتقدير الكافي والتي جاءت فعليًا من ملاحظة عملية حول المتوسطات المتحركة.
تم إنشاؤه بواسطة جون ر. ماكجينلي، CMT، والغرض الرئيسي منه هو حل المشكلات الشائعة للمتوسطات المتحركة التقليدية — وهي، التأخر و التذبذب السريع الناتجان عن تقلبات سرعة السوق.
إليك ما يحاول معالجته تحديدًا:
🧩 1. التأخر في المتوسطات المتحركة
- المتوسطات المتحركة العادية (SMA، EMA) تتأخر عن السعر لأنها تعتمد على فترات نظر ثابتة.
- يقوم McGinley Dynamic تلقائيًا بتكييف التنعيم بناءً على سرعة السوق.
عندما يتحرك السوق بسرعة، يسرع من تعديله؛ وعندما يبطئ السوق، ينعم التنعيم بشكل أكثر رقة.
👉 النتيجة: إنه يتتبع السعر بشكل أوثق دون رد فعل مفرط.
🌪️ 2. التذبذبات السريعة خلال الفترات المتقلبة
- يمكن للمتوسطات المتحركة التقليدية أن تعطي إشارات خاطئة في الأسواق المتقلبة.
- قدم McGinley مقامًا ديناميكيًا يتكيف بنسبة سرعة حركة السوق.
هذا يساعد على تقليل الضوضاء و تجنب إشارات التقاطع غير الضرورية.
⚙️ 3. سلوك أكثر سلاسة وتصحيحًا ذاتيًا
- يعمل تقريبًا كـ متوسط متحرك قابل للتعديل التلقائي، مما يعني أنك لا تحتاج إلى ضبط الفترة بدقة كبيرة.
- هذا يجعله أقل حساسية لإدخال المستخدم وتقلبات السوق — نوعًا ما متوسط متحرك "ذكي".
الملخص
ملخص الذكاء الاصطناعي
AlgoCorner McGinley Dynamic is a technical indicator designed to improve upon traditional moving averages by reducing lag and false signals. Created by John R. McGinley, CMT, it automatically adjusts its smoothing based on market speed, allowing it to track price movements more closely without overreacting. The indicator employs a dynamic denominator that changes in proportion to market velocity, helping to minimize whipsaws and avoid unnecessary crossover signals during volatile or choppy market conditions. Acting as a self-correcting, auto-adjusting moving average, it requires less fine-tuning of parameters and is less sensitive to market volatility and user input. This makes it a practical tool for traders seeking a smoother, more responsive moving average that adapts naturally to changing market dynamics. It is applicable to Forex markets, including currency pairs such as EURUSD and GBPUSD.
ملف تعريف المؤشر
تقييمات العملاء
0.0
التقييمات: 0
تقييمات العملاء
لا توجد تقييمات لهذا المنتج حتى الآن. هل جرَّبته بالفعل؟ كن أول من يخبر الآخرين!
مناقشة
الأسئلة الشائعة
Forex
EURUSD
GBPUSD
يتم توفير المنتجات المتاحة من خلال cTrader Store، بما في ذلك روبوتات التداول والمؤشرات والإضافات، من قبل مطوري الطرف الثالث وإتاحتها لأغراض الوصول المعلوماتي والفني فقط. cTrader Store ليس وسيطًا ولا يقدم نصائح استثمارية أو توصيات شخصية أو أي ضمان للأداء المستقبلي.


السعر
11
المبيعات
353
التثبيتات المجانية