
Descrizione
MarketSessions – Il tuo vantaggio nel trading, visualizzato
Trasforma il tempo di mercato in potere di trading
MarketSessions è un indicatore cTrader di livello professionale che dà vita alle sessioni di mercato globali — così puoi fare trading dove il momentum è reale e il tempismo diventa il tuo vantaggio.
🚀 Perché i trader si fidano di MarketSessions
Vedi il ritmo del mercato
Visualizza istantaneamente Londra, New York, Tokyo, Sydney – e qualsiasi altra sessione desideri – con sovrapposizioni pulite ed eleganti che si adattano al tuo grafico.
Fai trading in modo più intelligente, non più tardi
Ricevi notifiche in tempo reale quando le sessioni si aprono, chiudono o raggiungono livelli chiave – inviate tramite Telegram o Discord (a tua scelta).
Attacca le zone ad alta probabilità
Sfrutta gli strumenti integrati come Opening Range Breakout, Point of Control (POC) e linee di sessione di precisione così non perdi mai una rottura o un rifiuto.
🎯 Caratteristiche principali
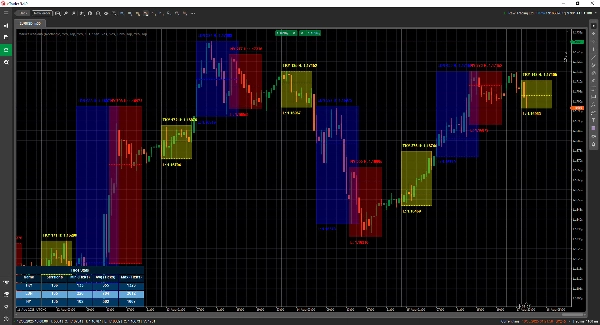
- Visualizzazione e gestione delle sessioni – orari, colori e etichette completamente personalizzabili, anche per mercati sovrapposti
- Strumenti di disegno avanzati – include disegnatori Double ❘❘ e Middle line, rettangoli di breakout, marcatori di testo e una Modalità Doppia Linea per trader minimalisti
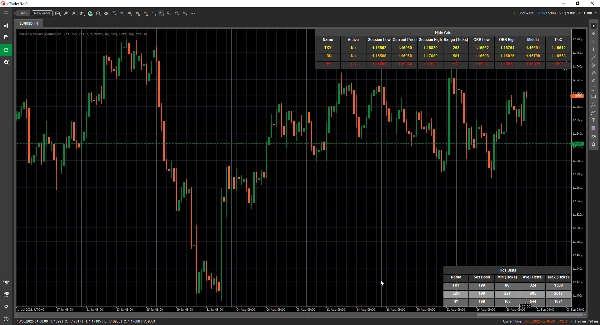
- Pannello Statistiche – visualizza il totale delle sessioni, intervalli Min, Avg e Max per ogni sessione (in Ticks, Pips o %)
- Modalità Griglia - consente di visualizzare le sessioni attive correnti in una tabella, così puoi vedere le sessioni in un timeframe superiore.
- Configurazione flessibile – personalizza la posizione del testo, le modalità di intervallo, le preferenze di disegno e i temi
- Avvisi e integrazioni – integrazione Telegram/Discord con avvisi sonori e visivi
📦 Cosa ottieni
- MarketSessions.algo (pronto all’uso)
- Aggiornamenti a vita (nessun costo ricorrente)
- Supporto amichevole (accesso diretto se hai bisogno di aiuto)
💻 Requisiti
- Piattaforma cTrader
- Runtime .NET 6.0
✅ Installa in pochi minuti
✅ Fai trading con assoluta fiducia
📘 Riferimento parametri (versione amichevole)
Elenco delle sessioni disponibili
- New York
- Londra
- Francoforte
- Tokyo
- Hong Kong
- Shanghai
- Singapore
- Wellington
- Sydney
- Toronto
Impostazioni generali
- Modalità di disegno – Scegli come vengono disegnate le linee di sessione sul grafico (Rettangolo / Doppia Linea / Linea Centrale)
- Mostra nome sessione – Visualizza il nome di ogni sessione direttamente sul grafico
- Posizione nome sessione – Decidi dove appare il testo del nome sessione (alto, centro, basso)
- Testo in grassetto – Rende il nome della sessione in grassetto per facilitarne la lettura
- Offset testo superiore – Aggiunge spazio extra dalla parte superiore (per evitare sovrapposizioni con le candele)
- Offset testo inferiore – Aggiunge spazio extra dalla parte inferiore dell’area della sessione
- Posizione orario testo – Mostra l’orario della sessione insieme al nome della sessione
- Usa nome sessione breve – Passa a nomi più corti (es. NY invece di New York)
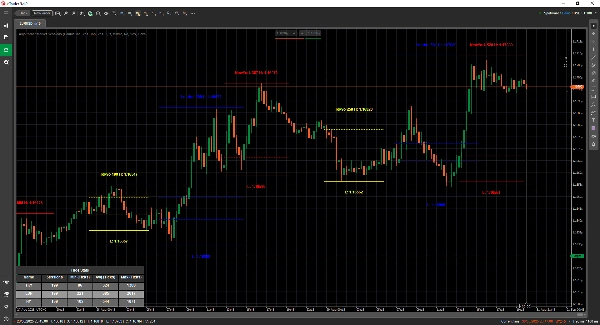
- Mostra intervallo sessione – Evidenzia l’intero intervallo di prezzo coperto dalla sessione
- Modalità intervallo sessione – Scegli come viene calcolato l’intervallo di prezzo (alto/basso o apertura/chiusura)
- Posizione intervallo sessione – Posiziona il marcatore dell’intervallo in alto o in basso
- Mostra massimo – Visualizza il prezzo massimo della sessione
- Posizione massimo – Scegli dove appare l’etichetta del massimo
- Mostra minimo – Visualizza il prezzo minimo della sessione
- Posizione minimo – Scegli dove appare l’etichetta del minimo
- Estendi linee massimo/minimo (minuti) - Permette di estendere queste linee per x minuti in avanti
- Mostra breakout intervallo apertura – Disegna un riquadro di breakout all’apertura della sessione
- Estendi linee ORB (minuti) - Permette di estendere queste linee per x minuti in avanti
- Mostra linee medie – Aggiungi linee mediane per aiutare a identificare il valore equo
- Estendi linee medie (minuti) - Permette di estendere questa linea per x minuti in avanti
- Mostra PoC – Visualizza il Point of Control (prezzo più scambiato della sessione)
- Estendi linee medie (minuti) - Permette di estendere questa linea per x minuti in avanti
- Trasparenza riempimento – Controlla quanto è trasparente il riempimento di sfondo della sessione
Statistiche
- Mostra statistiche – Mostra/nascondi il pannello delle statistiche sul grafico
- Allineamento orizzontale statistiche – Allinea il pannello (Sinistra / Centro / Destra)
- Allineamento verticale statistiche – Scegli se il pannello appare in alto o in basso
- Colore titolo – Colore del testo per il titolo “Statistiche”
- Colore righe pari – Colore di sfondo per le righe pari nel pannello
- Colore righe dispari – Colore di sfondo per le righe dispari nel pannello
- Colore primo piano – Colore del testo usato all’interno del pannello
Telegram
- Usa – Abilita o disabilita gli avvisi Telegram
- Token – Il token del tuo Bot Telegram
- ChatId – L’ID della chat dove verranno inviati gli avvisi
Discord
- Usa – Abilita o disabilita gli avvisi Discord
- WebhookUrl – URL webhook Discord per inviare avvisi di sessione
Avvisi sonori
- Avviso sonoro nuova sessione – Riproduce un suono quando inizia una nuova sessione
- Avviso sonoro sessione completata – Riproduce un suono quando una sessione termina
Griglia
- Forza griglia - Forza il rendering della griglia indipendentemente dal TimeFrame utilizzato
- Griglia visibile per TimeFrame superiore - Ti permette di selezionare a partire da quale TimeFrame questa griglia è visibile
- Notifica messaggio a comparsa - Notifica il motivo per cui la modalità di rendering normale non è possibile e passa alla modalità griglia
- Allineamento orizzontale griglia
- Allineamento verticale griglia
Esempio di sessione (New York)
⚠️ Gli stessi parametri si applicano a ogni sessione (Londra, Tokyo, Sydney, ecc.)
- Attiva – Abilita o disabilita questa specifica sessione
- Colore – Colore della sessione usato sul grafico
- Riempimento area – Riempi lo sfondo dell’area della sessione
- Stile linea – Scegli lo stile della linea (solida, tratteggiata, ecc.)
- Spessore linea – Controlla lo spessore dei bordi della sessione
Fai del orologio del mercato il tuo alleato
Acquista MarketSessions oggi e non perdere mai più una sessione redditizia.
Riepilogo
Users can view comprehensive session statistics, including total sessions, minimum, average, and maximum ranges measured in ticks, pips, or percentages. A grid mode enables viewing active sessions in a table format suitable for higher timeframes. The indicator supports real-time alerts via Telegram or Discord for session openings, closings, and key levels, complemented by sound and visual notifications.
Additional configurable options include display preferences for session names, price ranges, high/low prices, opening range breakouts, middle lines, and the Point of Control (most traded price). The indicator requires the .NET 6.0 runtime and offers lifetime updates and support. It is applicable to major forex symbols such as EURUSD, GBPUSD, NZDUSD, and USDJPY.
Recensioni dei clienti
5 | 100 % | |
4 | 0 % | |
3 | 0 % | |
2 | 0 % | |
1 | 0 % |


![Logo di "Smart Money Concepts (SMC) [Iridio Capital]"](https://cdn.ctrader.com/image/webp/28b69fd1-ef54-4bed-9487-07e78e883be4_40934)


