คำอธิบาย
Impulse Matrix Pro 🚀
มันคืออะไร?
https://chartshots.spotware.com/c/69d5282dc32e0
Impulse Matrix Pro เป็นตัวบ่งชี้แบบซ้อนที่สร้าง สัญญาณซื้อและขาย 📈📉 เฉพาะเมื่อ สามเครื่องยนต์อิสระ เห็นพ้องพร้อมกัน มันรวมการตรวจจับแนวโน้ม การทะลุแรงกระตุ้น และตัวกรองอัจฉริยะเข้าด้วยกันในระบบเดียวที่มีระดับการจัดการความเสี่ยงในตัว 🛡️.
https://chartshots.spotware.com/c/69d5293d873fa
สามเครื่องยนต์ ⚙️
https://chartshots.spotware.com/c/69d5288a347ea
เครื่องยนต์ 1 — แนวโน้ม (SMEMA) 🌊
ค่าเฉลี่ยเคลื่อนที่แบบเรียบสองชั้น (เอ็กซ์โพเนนเชียล → จากนั้นแบบง่าย) สร้าง เส้น Nexus.
- ถ้ามันกำลังขึ้น → แนวโน้มเป็น ขาขึ้น 🟢.
- ถ้ากำลังลง → ขาลง 🔴.
รอบ ๆ มัน, แถบซองจดหมาย 3 แถบ ถูกวาดขึ้นด้านบนและด้านล่าง โดยเว้นระยะด้วยช่วงเทียนเฉลี่ยที่เรียบ ค่าเงินที่สัมพันธ์กับแถบเหล่านี้กำหนด ความแข็งแกร่ง (0–3):
ความแข็งแกร่ง
ความหมาย
1/3
ราคานอกเหนือจากแถบ 1
2/3
ราคานอกเหนือจากแถบ 2
3/3
ราคานอกเหนือจากแถบ 3 ⚡
ความแข็งแกร่งขั้นต่ำที่สูงขึ้น = สัญญาณน้อยลงแต่ คุณภาพสูงกว่า
เครื่องยนต์ 2 — แรงกระตุ้น (BOSWaves)
ตรวจจับ เหตุการณ์การทะลุโครงสร้าง โดยใช้แถบไดนามิกที่สร้างจาก:
- เส้นฐาน EMA
- ค่าเบี่ยงเบนสัมบูรณ์เฉลี่ย (MAD) เป็นหน่วยความผันผวน
พฤติกรรมหลัก: แถบจะหดตัวหลังการเคลื่อนไหวที่รุนแรง (ทำให้ทริกเกอร์ง่ายขึ้น) และขยายตัวในช่วงการรวมตัว (ทำให้ทริกเกอร์ยากขึ้น) ซึ่งควบคุมโดยคะแนน ความสดใหม่ของแรงกระตุ้น ที่ลดลงตามเวลา ⏳.
- การทะลุขาขึ้น: ราคาปิดก่อนหน้า ≤ แถบบน ราคาปิดปัจจุบันข้ามขึ้นเหนือมัน 🚀.
- การทะลุขาลง: ราคาปิดก่อนหน้า ≥ แถบล่าง ราคาปิดปัจจุบันข้ามลงต่ำกว่า 📉.
เครื่องยนต์ 3 — ตัวกรองอัจฉริยะ 🛡️
สามประตูที่สัญญาณทุกตัวต้องผ่าน:
- ความผันผวน ATR: ตลาดมีการเคลื่อนไหวเพียงพอสำหรับการเทรด 🌊
- โมเมนตัม: ราคากำลังเคลื่อนที่ไปในทิศทางของสัญญาณจริง ๆ ในช่วง N แท่ง 🏃♂️
- ความสดใหม่: แรงกระตุ้นยังไม่เสื่อมสภาพ — การเคลื่อนไหวยัง "มีชีวิต" 🔥
เงื่อนไขสัญญาณ 🚦
ซื้อ — ต้องเป็นจริงทั้งหมด 7 ข้อ: ✅
- เส้น Nexus กำลังขึ้น
- ความแข็งแกร่งของขาขึ้น ≥ เกณฑ์ขั้นต่ำ
- ตรวจพบการทะลุขาขึ้นของแรงกระตุ้น
- ทิศทางเปลี่ยนจากขาลงเป็นขาขึ้น
- ผ่านตัวกรอง ATR
- โมเมนตัมยืนยันการเคลื่อนไหวขึ้น
- ความสดใหม่ของแรงกระตุ้นสูงกว่าเกณฑ์
ขาย — ต้องเป็นจริงทั้งหมด 7 ข้อ: ✅
- เส้น Nexus กำลังลง
- ความแข็งแกร่งของขาลง ≥ เกณฑ์ขั้นต่ำ
- ตรวจพบการทะลุขาลงของแรงกระตุ้น
- ทิศทางเปลี่ยนจากขาขึ้นเป็นขาลง
- ผ่านตัวกรอง ATR
- โมเมนตัมยืนยันการเคลื่อนไหวลง
- ความสดใหม่ของแรงกระตุ้นสูงกว่าเกณฑ์
หมายเหตุ: หากเงื่อนไขใดเงื่อนไขหนึ่งล้มเหลว → ไม่มีสัญญาณ ❌.
ตรรกะการหยุดขาดทุน & ทำกำไร 📏
ทุกระดับเป็น อิงตาม ATR และปรับตัวได้เต็มที่ ตามความผันผวนปัจจุบัน 🔄.
- ระยะหยุดขาดทุน = ATR × ตัวคูณ SL (ค่าเริ่มต้น 1.5)
ระดับ
การคำนวณ
อัตราส่วน R:R เริ่มต้น
SL
เข้า ∓ (ATR × 1.5)
— 🛑
TP1
เข้า ± (ระยะ SL × 1.0)
1:1 🎯
TP2
เข้า ± (ระยะ SL × 2.0)
1:2 🎯🎯
TP3
เข้า ± (ระยะ SL × 3.0)
1:3 💰
ตลาดผันผวน → หยุดและเป้าหมายกว้างขึ้น. ตลาดเงียบ → ระดับเข้มงวดขึ้น ทุกอย่างปรับขนาดโดยอัตโนมัติ ⚖️.
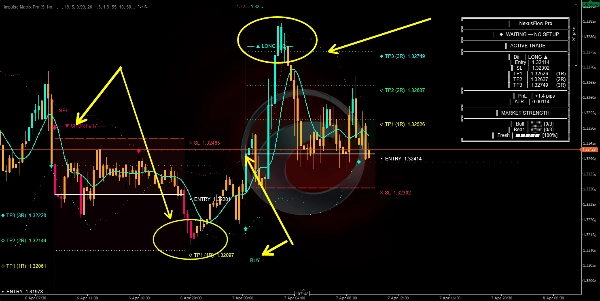
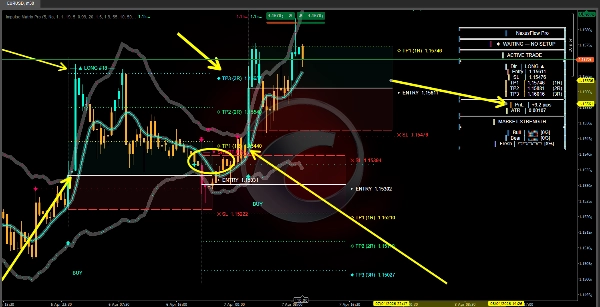
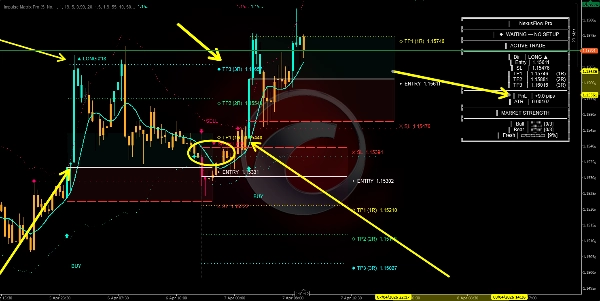
องค์ประกอบภาพ 🎨
- เส้น Nexus: ทิศทางแนวโน้มกลาง 🧵
- แถบซองจดหมาย: โซนวัดความแข็งแกร่งพร้อมการไล่ระดับสีเติม 📊
- แถบแรงกระตุ้น (จุด): เกณฑ์การทะลุไดนามิก 🏁
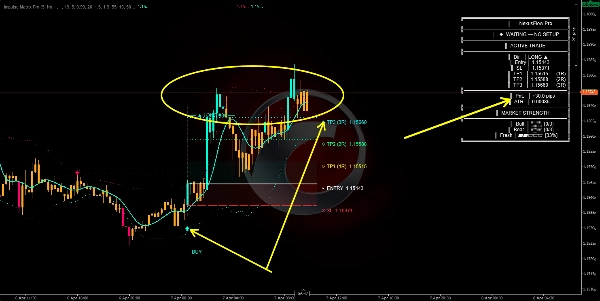
- ลูกศรซื้อ / ขาย: สัญญาณเข้าที่ได้รับการยืนยัน 🏹
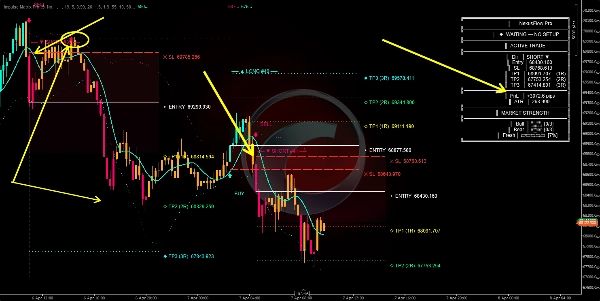
- เพชรสีขาว: จุดเปลี่ยนแนวโน้มบนเส้น Nexus 💎
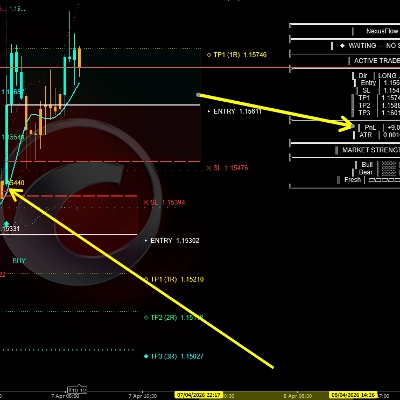
- เส้นเข้า / SL / TP: ระดับการเทรดที่คาดการณ์ไว้ 📐
- โซนสีแดง: พื้นที่ความเสี่ยง (จากเข้าไปยัง SL) ⚠️
- โซนสีเขียว/ฟ้า: พื้นที่รางวัล (จากเข้าไปยัง TP1) 🏆
- ดาว + เส้นแนวนอน: สัญญาณทดสอบซ้ำ — ราคากลับไปที่แถบแรงกระตุ้นโดยไม่ทะลุ ⭐
- เมฆแนวโน้ม: เงาพื้นหลังละเอียดที่แสดงทิศทางหลัก ☁️
- สีแท่ง: ฟ้า = ขาขึ้น · ชมพู = ขาลง · ส้ม = ไม่มีการตั้งค่า 🎨
- แผงข้อมูล (มุมบนขวา): ข้อมูลการเทรดสด, กำไร/ขาดทุน, มาตรวัดความแข็งแกร่ง, เกจความสดใหม่ 🖥️
วิธีใช้ 📖
- รอลูกศรซื้อ/ขาย 🏹 — แท่งสีส้มหมายถึงไม่มีการตั้งค่า ให้ออกห่าง 🛑.
- ตรวจสอบแผงข้อมูล 🖥️ — ความแข็งแกร่งและความสดใหม่ที่สูงขึ้น = ความมั่นใจที่สูงขึ้น.
- เทรดตามระดับที่คาดการณ์ไว้ 📏 — SL ที่ระบุไว้, ทำกำไรบางส่วนที่ TP1/TP2, ปล่อยส่วนที่เหลือไปถึง TP3.
- ทดสอบซ้ำด้วยดาว ⭐ สามารถใช้เป็นโอกาสเพิ่มตำแหน่งในตำแหน่งที่มีอยู่.
- สัญญาณตรงกันข้าม 🔄 = การเทรดก่อนหน้าถูกยกเลิกแนวคิด.
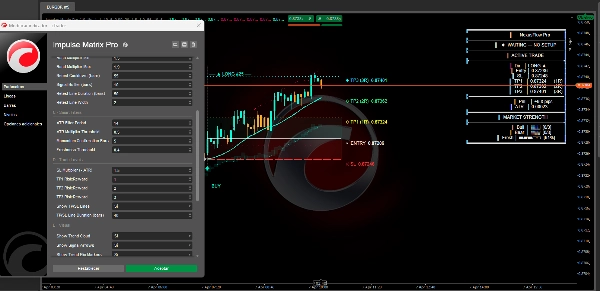
พารามิเตอร์หลัก ⚙️
พารามิเตอร์
ค่าสูงกว่า
ค่าต่ำกว่า
รอบวัฏจักร
แนวโน้มเรียบกว่า สัญญาณช้ากว่า
เร็วกว่า ตอบสนองมากขึ้น ⚡
ความแข็งแกร่งขั้นต่ำ
สัญญาณน้อยลง ตัวกรองเข้มงวดขึ้น
สัญญาณมากขึ้น ตัวกรองน้อยลง 🔍
ความยาว EMA แนวโน้ม
เส้นฐานแรงกระตุ้นเรียบกว่า
ทะลุที่ตอบสนองมากขึ้น 🌊
ตัวคูณแถบ
แถบแรงกระตุ้นกว้างขึ้น ทะลุน้อยลง
แถบแคบลง ทะลุมากขึ้น 📏
เกณฑ์ ATR
ต้องการความผันผวนที่แรงขึ้น 🌪️
อนุญาตสัญญาณความผันผวนต่ำ
เกณฑ์ความสดใหม่
เฉพาะแรงกระตุ้นสดเท่านั้นที่ผ่านเกณฑ์ 🔥
อนุญาตแรงกระตุ้นที่เสื่อมสภาพ
ตัวคูณ SL
หยุดขาดทุนกว้างขึ้น 🛡️
หยุดขาดทุนแคบลง 🎯
อัตราส่วน TP
เป้าหมายที่ทะเยอทะยานมากขึ้น 💰
เป้าหมายที่อนุรักษ์นิยมมากขึ้น
ข้อจำกัดความรับผิดชอบ ⚠️
ตัวบ่งชี้นี้ ไม่ดำเนินการเทรด เป็นเครื่องมือวิเคราะห์ 🧠. ระดับ TP/SL เป็นคำแนะนำที่อิงความผันผวน ไม่ใช่การรับประกันราคา ทำงานได้ดีที่สุดใน สภาวะแนวโน้ม 📈. ควรรวมกับการวิเคราะห์โครงสร้างตลาดและการจัดการความเสี่ยงที่เหมาะสม.
สรุป
รีวิวจากลูกค้า
5 | 100 % | |
4 | 0 % | |
3 | 0 % | |
2 | 0 % | |
1 | 0 % |