
Açıklama
🚀 Kanal Kopuş Sistemi
Bu uzmanlaşmış algoritma, güvenilir sinyaller sağlamak için birden fazla teknik analiz öğesini birleştirerek giriş ve çıkış noktalarını kesinlikle doğrulamak üzere tasarlanmıştır 🎯.
🔍 Nasıl Çalışır?
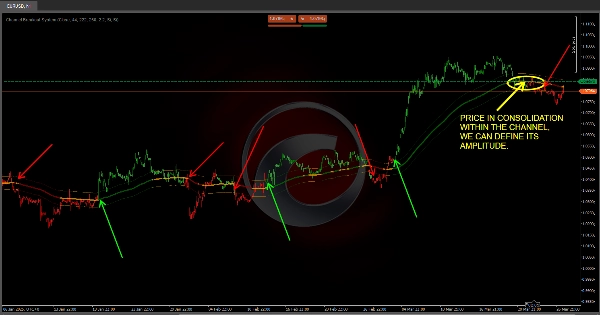
📊 Volatilite Tabanlı Kanal (ATR)
✅ Piyasa volatilitesi ATR (Ortalama Gerçek Aralık) 📉 kullanılarak hesaplanır.
✅ "Trend MA", bu volatiliteye orantılı bir değer eklenip çıkarılarak ayarlanır ve piyasanın "tavan" ve "taban" işlevi gören iki noktalı çizgi oluşturur.
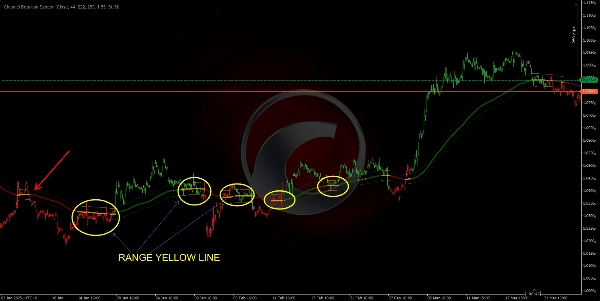
✅ Bu sizin için ne anlama geliyor? Fiyat kanal içinde kalıyorsa, piyasa yatayda ya da konsolidasyonda olabilir; net bir kopuş olursa, bu güçlü bir trend hareketi sinyalidir 📈📉.
✅ Tamamen özelleştirilebilir! Kanal ayarlarını stratejinize göre ayarlayın 📌.
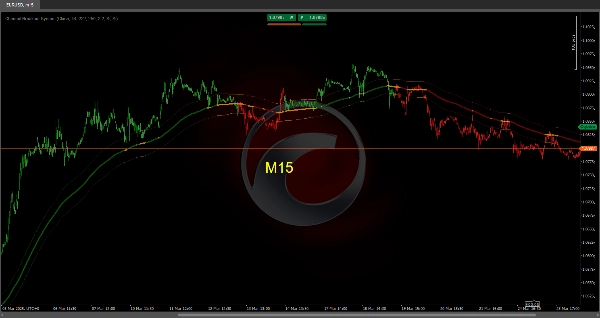
🟢 Akıllı Renklerle Trend Tespiti
🔹 Gösterge, hızlı MA konumunu orta MA ile ve her ikisini de Trend MA ile karşılaştırır.
🔹 Piyasa aşamasına bağlı olarak, mumlar renk değiştirir:
- 🟢 Yeşil → Boğa piyasası aşaması.
- 🔴 Kırmızı → Ayı piyasası aşaması.
- 🟠 Turuncu veya nötr → Olası konsolidasyon veya belirsizlik.
🔹 Fiyat ve hareketli ortalamalar kanal içinde "sıkışmışsa", bu bir konsolidasyon aşaması sinyalidir ve kararsız bölgelerde işlem yapmaktan kaçınmanıza yardımcı olur.
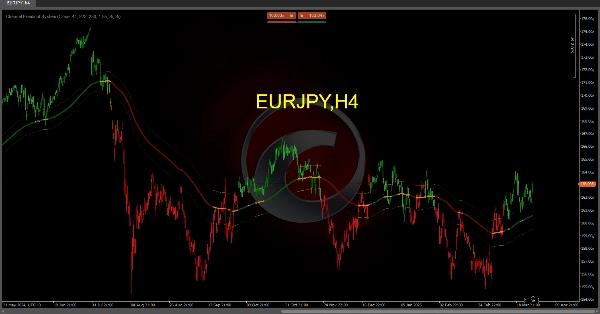
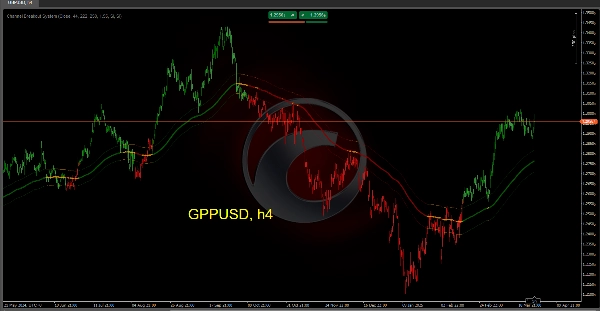
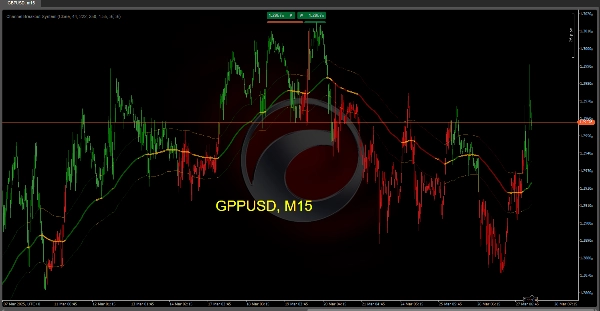
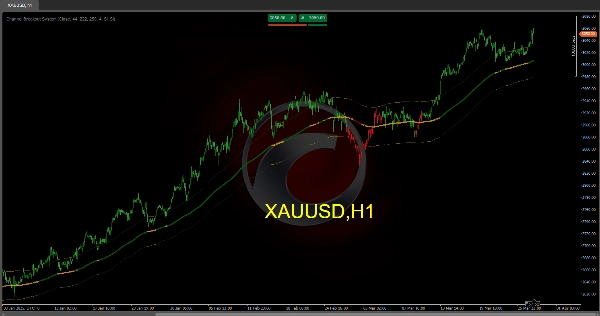
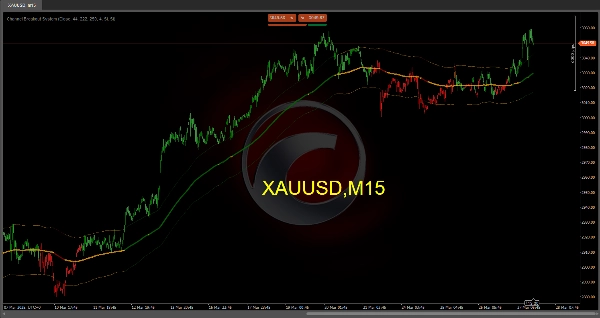
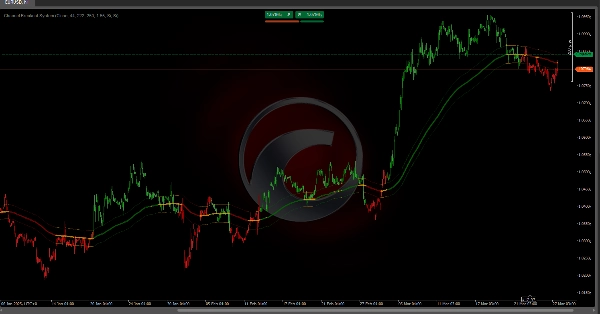
🎯 Grafikte Nasıl Görünür?
🔵 Ana trend çizgisi: Piyasa yönüne göre renk değiştirir (yeşil, kırmızı veya turuncu).
📏 Noktalı kanal: Volatiliteye dayalı piyasa aralığını yansıtır.
📊 Renkli çubuklar: Mevcut piyasa aşamasının kolay görsel temsilini sağlar.
🚀 Neden Bu Sistemi Kullanın?
✔ Piyasanın trendde mi yoksa yatayda mı olduğunu hızlıca belirler.
✔ Trend gücünü ve yönünü görsel olarak vurgular.
✔ Net kopuş ve kesişim sinyalleriyle potansiyel dönüşleri önceden tahmin eder.
✔ Giriş ve çıkış noktalarını doğrular, yanlış sinyalleri azaltır ve işlem doğruluğunu artırır.
🔹 Ticaretinizi optimize edin ve daha fazla güvenle işlem yapın Kanal Kopuş Sistemi 🏆 ile. En iyi piyasa fırsatlarını yakalamaya hazır olun! 📈🔥
Ctrader Store göstergeleri:
Dynamic Market Structure
Analysis of Turning Points
Fibonacci Linear
Regression Multi-timeframe
Multi-Level Candle Bias
Tracker
Auto Support and
Resistance Trend Lines
All Support and
Resistance Levels
Özet
Müşteri değerlendirmeleri
5 | 33 % | |
4 | 67 % | |
3 | 0 % | |
2 | 0 % | |
1 | 0 % |


