
Consolidation Zones
อินดิเคเตอร์
1 การซื้อ
เวอร์ชัน 1.0, Oct 2025
Windows, Mac
4.0
รีวิว: 1
คำอธิบาย
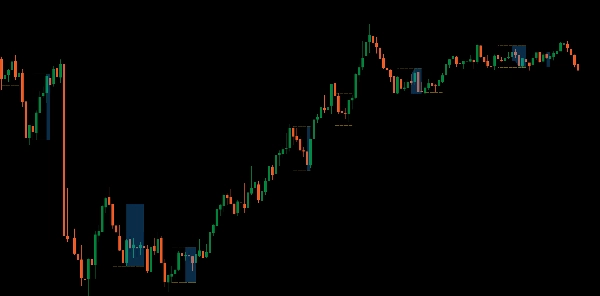
ขอแนะนำ ตัวบ่งชี้ Consolidation Zones ที่ออกแบบมาเพื่อช่วยให้คุณระบุและใช้ประโยชน์จากโอกาสในการเบรกเอาท์ได้อย่างง่ายดาย
เครื่องมือที่ทรงพลังนี้เน้นโซนบนแผนภูมิของคุณที่ราคากำลังรวมตัวกัน ทำให้ง่ายต่อการสังเกตจุดเบรกเอาท์ที่เป็นไปได้ โดยการแสดงภาพพื้นที่สำคัญเหล่านี้ คุณจะสามารถคาดการณ์การเคลื่อนไหวของตลาดได้ดีขึ้นและตัดสินใจซื้อขายอย่างมีข้อมูลมากขึ้น
เหมาะสำหรับเทรดเดอร์ที่ต้องการพัฒนากลยุทธ์ด้วยข้อมูลเชิงลึกที่ชัดเจนและนำไปใช้ได้จริง อัปเกรดชุดเครื่องมือการซื้อขายของคุณและเชี่ยวชาญการเบรกเอาท์ด้วยตัวบ่งชี้ Consolidation Zones
สรุป
สรุปโดย AI
The Consolidation Zones indicator identifies and visualizes price consolidation areas on trading charts to help traders spot potential breakout points. By highlighting these zones, it assists in anticipating market movements and supports more informed decision-making. This tool is applicable across multiple markets, including Forex, cryptocurrencies (e.g., BTCUSD), commodities (e.g., gold, oil), indices (e.g., NAS100, SP500), and stocks. It is designed to enhance trading strategies focused on breakout opportunities by providing clear visual cues of consolidation phases.
โปรไฟล์อินดิเคเตอร์
รีวิวจากลูกค้า
4.0
รีวิว: 1
5 | 0 % | |
4 | 100 % | |
3 | 0 % | |
2 | 0 % | |
1 | 0 % |
รีวิวจากลูกค้า
October 12, 2025
Two timeframes give more context, and the log becomes easier to read.
การสนทนา
คำถามที่พบบ่อย
BTCUSD
Forex
Breakout
Indices
EURUSD
Commodities
GBPUSD
NZDUSD
Prop
Crypto
Stocks
XAUUSD
NAS100
USDJPY
ผลิตภัณฑ์ที่มีให้บริการผ่าน cTrader Store รวมถึงบอทการเทรด อินดิเคเตอร์ และปลั๊กอิน มีให้บริการโดยนักพัฒนาบุคคลที่สามและมีไว้เพื่อวัตถุประสงค์ในการเข้าถึงข้อมูลและทางเทคนิคเท่านั้น cTrader Store ไม่ใช่โบรกเกอร์และไม่ได้ให้คำแนะนำการลงทุน คำแนะนำส่วนบุคคล หรือการรับประกันผลการดำเนินงานในอนาคต


!["High-Low Divergence [Iridio Capital]" โลโก้](https://cdn.ctrader.com/image/webp/443c4661-7abb-40f1-842f-4b6ec560649b_40914)


ราคา
ตั้งแต่ 25/09/2025
25
การขาย
316
ติดตั้งฟรี