
설명
개인화된 기능으로 거래 경험을 향상시키기 위해 설계된 맞춤형 클래식 MACD 지표를 소개합니다.
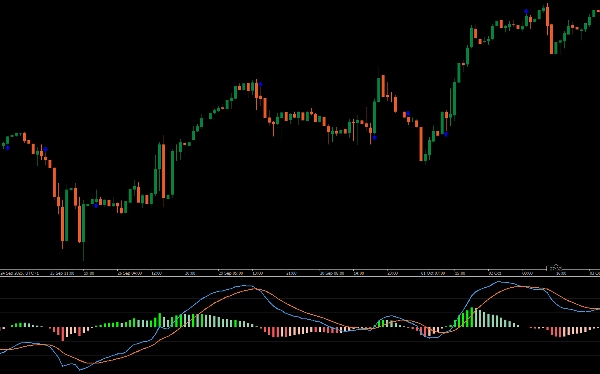
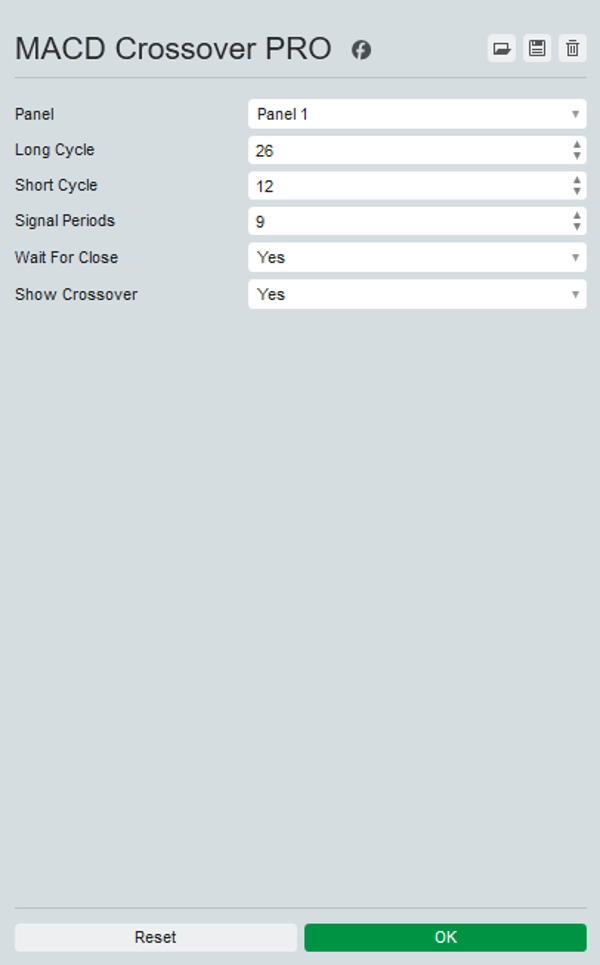
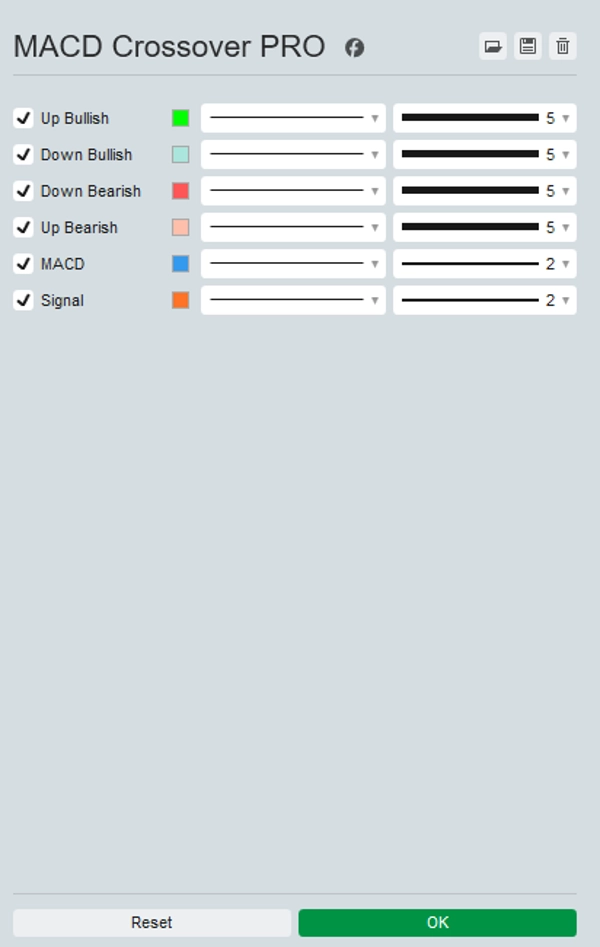
전통적인 MACD의 업그레이드 버전으로, 선과 히스토그램의 색상을 사용자 지정하여 차트 시각화를 더욱 명확하게 할 수 있습니다. 선택적으로 캔들 마감 대신 틱 데이터를 사용하여 실시간으로 업데이트할 수 있어 빠르게 변하는 시장에서 시기적절한 인사이트를 제공합니다.
또한, 차트에 직접 교차점을 강조 표시하여 잠재적인 매수 및 매도 신호를 쉽게 식별할 수 있습니다.
정확성과 의사결정 향상을 위해 맞춤형 클래식 MACD 지표로 거래 전략을 강화하세요.
요약
AI 요약
MACD Crossover PRO is a customizable version of the classic MACD (Moving Average Convergence Divergence) indicator designed for enhanced trading analysis. It allows users to personalize the colors of the MACD lines and histogram for improved chart clarity. The indicator supports real-time updates based on tick data rather than waiting for candle closes, providing more immediate insights in fast-moving markets. It also visually highlights crossover points on the chart, aiding in the identification of potential buy and sell signals. This tool is applicable across various markets including Forex, cryptocurrencies, stocks, commodities, and indices, supporting symbols such as BTCUSD, EURUSD, GBPUSD, XAUUSD, NAS100, and USDJPY. The indicator is suited for traders employing strategies like scalping and signal-based entries, aiming to improve precision and decision-making through enhanced visualization and timely data updates.
지표 프로필
고객 리뷰
5.0
리뷰: 1
5 | 100 % | |
4 | 0 % | |
3 | 0 % | |
2 | 0 % | |
1 | 0 % |
고객 리뷰
October 15, 2025
The first test should keep DD under 3 percent. The review process gets less scattered.
상담
자주 묻는 질문(FAQ)
BTCUSD
Forex
Signal
Indices
EURUSD
Commodities
GBPUSD
NZDUSD
Prop
Scalping
Crypto
Stocks
XAUUSD
NAS100
MACD
USDJPY
트레이딩 봇, 지표, 플러그인 등 cTrader Store에서 제공되는 상품은 제3자 개발자에 의해 제공되며, 이는 단순히 정보 및 기술적 접근을 목적으로 제공된 것입니다. cTrader Store는 중개인이 아니며, 투자 조언, 개인별 추천 또는 향후 성과에 대한 어떠한 보장도 제공하지 않습니다.


가격
가입일 25/09/2025
25
판매
315
무료 설치