


Açıklama
#### Özellikler
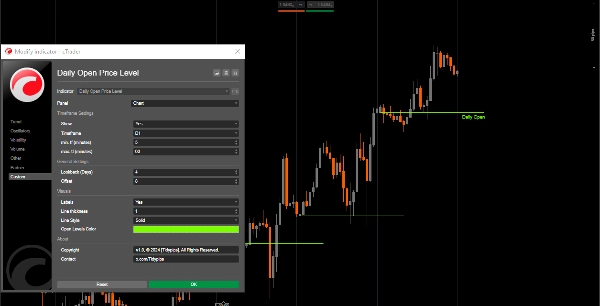
- **Özelleştirilebilir Zaman Dilimi**: Kullanıcılar açılış seviyelerini analiz etmek için belirli bir zaman dilimi (örneğin, günlük) seçebilir. 1H'den küçük herhangi bir ZD ayarlamayın.
- **Geriye Dönük Dönem**: Gösterge, tüccarların son fiyat hareketlerine odaklanmasını ve ilgili ilgi noktalarını belirlemesini sağlayan bir geriye dönük dönem destekler.
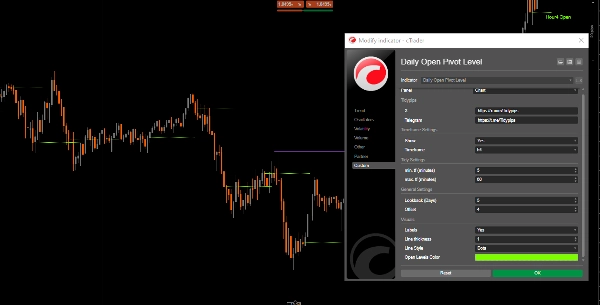
- **Dinamik Trend Çizgileri**: Seçilen zaman diliminin açılış fiyatını göstermek için trend çizgileri çizer ve potansiyel destek ve direnç seviyeleri için net görsel ipuçları sağlar.
- **Etiketleme Seçenekleri**: Tüccarlar, açılış fiyatını doğrudan grafikte göstermek için etiketleri etkinleştirebilir, böylece netlik ve anlayışı artırır.
- **Görsel Özelleştirme**: Kullanıcılar, tercihlerine uygun olarak çizgi renklerini, stillerini ve kalınlıklarını özelleştirerek grafik okunabilirliğini artırabilir.
- **Zaman Dilimi Kısıtlamaları**: Gösterge, yalnızca belirtilen minimum ve maksimum zaman dilimi ayarları içinde çalışmasını sağlamak için kontroller içerir ve yanıltıcı sinyallerin önüne geçer.
#### Eğitim
1. **Kurulum**: İstediğiniz zaman dilimini, geriye dönük dönemi seçmek ve çizgi rengi ile kalınlığı gibi görsel parametreleri özelleştirmek için gösterge ayarlarını açın.
2. **Göstergeyi Kullanma**: Uygulandıktan sonra, gösterge belirtilen ayarlara göre açılış fiyat seviyelerini otomatik olarak grafiğinize çizecektir.
3. **Analiz**: İşlem yaparken çizilen seviyeleri gözlemleyin. Bu seviyeleri potansiyel destek ve direnç bölgelerini belirlemek ve bilinçli ticaret kararları almak için kullanın.
#### Önerilen Yardımcı Araçlar
- **cTrader**: cAlgo için yerel platform, göstergeleri kullanma ve özelleştirme konusunda sorunsuz bir deneyim sunar.
- **Teknik Analiz Araçları**: Bu göstergeleri hareketli ortalamalar veya osilatörler gibi diğer araçlarla birleştirerek ticaret stratejinizi ve piyasa analizini geliştirin.
- **Risk Yönetimi Araçları**: Pozisyon büyüklüğü hesaplayıcıları ve stop-loss araçlarını kullanarak belirlenen açılış seviyeleri etrafında işlem yaparken riski etkili bir şekilde yönetin.
Günlük Açılış Pivot Seviyesi Göstergesini bu araçlarla entegre ederek, tüccarlar piyasa analizlerini geliştirebilir ve gün içi ticaretin karmaşıklıklarında başarı şanslarını artırabilirler.
Özet
Müşteri değerlendirmeleri
5 | 100 % | |
4 | 0 % | |
3 | 0 % | |
2 | 0 % | |
1 | 0 % |


