
คำอธิบาย
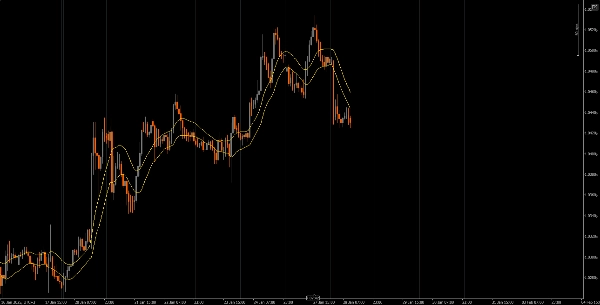
ค่าเฉลี่ยเคลื่อนที่ (MAs) ที่ปรับแต่งได้บนกราฟ โดยใช้ประเภทของ MA ที่แตกต่างกัน (Simple, Weighted, Exponential) และแหล่งข้อมูลราคาต่างๆ (ปิด, เปิด, สูง, ต่ำ)
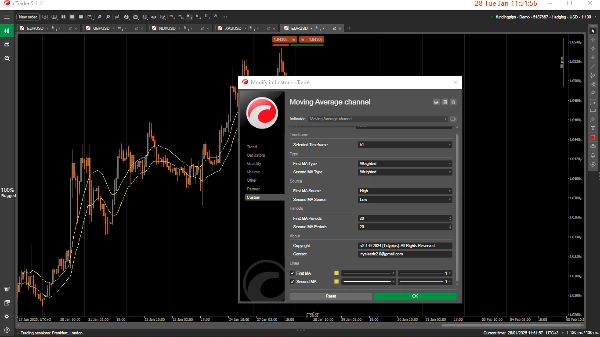
ตัว WMA และ SMA Indicator ให้ความยืดหยุ่นในการแสดงค่าเฉลี่ยเคลื่อนที่ตามพารามิเตอร์ที่ผู้ใช้กำหนด รองรับค่าเฉลี่ยเคลื่อนที่สามประเภท: Simple (SMA), Weighted (WMA) และ Exponential (EMA) ผู้ใช้สามารถใช้ค่าเฉลี่ยเหล่านี้กับแหล่งข้อมูลต่างๆ เช่น ปิด, เปิด, สูง, ต่ำ หรือค่าที่คำนวณ เช่น ค่ากลาง, ค่าทั่วไป และ ราคาถ่วงน้ำหนัก.
เครื่องมือนี้ยังช่วยให้คุณเลือกช่วงเวลาที่ตัวบ่งชี้ทำงานได้ เพื่อให้คุณสามารถมุ่งเน้นไปที่ช่วงข้อมูลเฉพาะโดยไม่ทำให้กราฟของคุณรกด้วยข้อมูลที่ไม่จำเป็น
ลองดูตัวบ่งชี้ที่มีประโยชน์อื่นๆ ที่ฉันได้เผยแพร่ หากคุณพบว่าตัวบ่งชี้นี้หรือเครื่องมืออื่นๆ ของฉันมีประโยชน์ โปรดพิจารณาสนับสนุนงานของฉันโดยการซื้อหรือบริจาค การสนับสนุนของคุณไม่เพียงแต่ช่วยให้ฉันพัฒนาต่อและปรับปรุงเครื่องมือเหล่านี้ แต่ยังช่วยให้ฉันสามารถสร้างตัวบ่งชี้ใหม่ๆ ที่มีคุณค่าเพื่อเพิ่มประสบการณ์การเทรดของคุณ ขอบคุณสำหรับการสนับสนุนอย่างต่อเนื่องของคุณ!
https://buymeacoffee.com/tidypips


