
설명
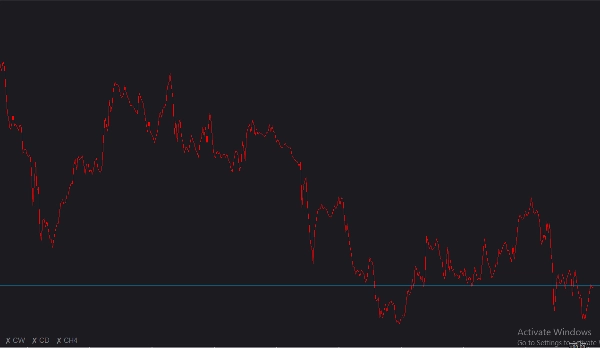
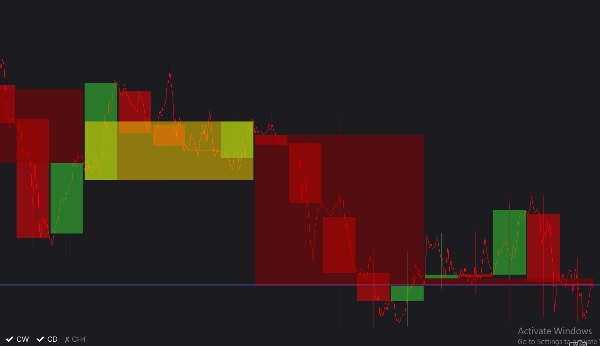
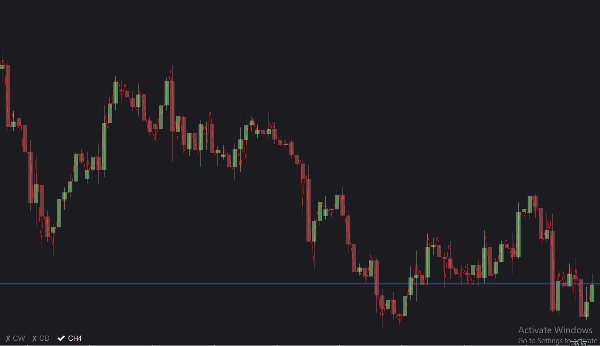
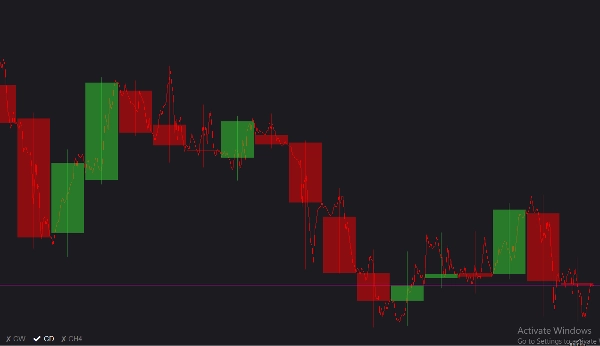
상세 소개 (ViPi) MTF 캔들은 트레이더가 활성 차트를 떠나지 않고도 상위 관점의 시장을 파악할 수 있도록 설계된 매우 상호작용적이고 사용자 정의 가능한 차트 도구입니다. 최대 세 개의 서로 다른 상위 시간대(MTF) 캔들을 현재 뷰에 원활하게 오버레이하여 거시경제 동향, 주요 지지/저항 수준 및 시장 변화를 한눈에 쉽게 파악할 수 있습니다. 깔끔하고 방해되지 않는 차트 내 토글 메뉴를 특징으로 하며, 각 시간대를 즉시 숨기거나 표시할 수 있어 작업 공간을 깔끔하고 집중된 상태로 유지할 수 있습니다.
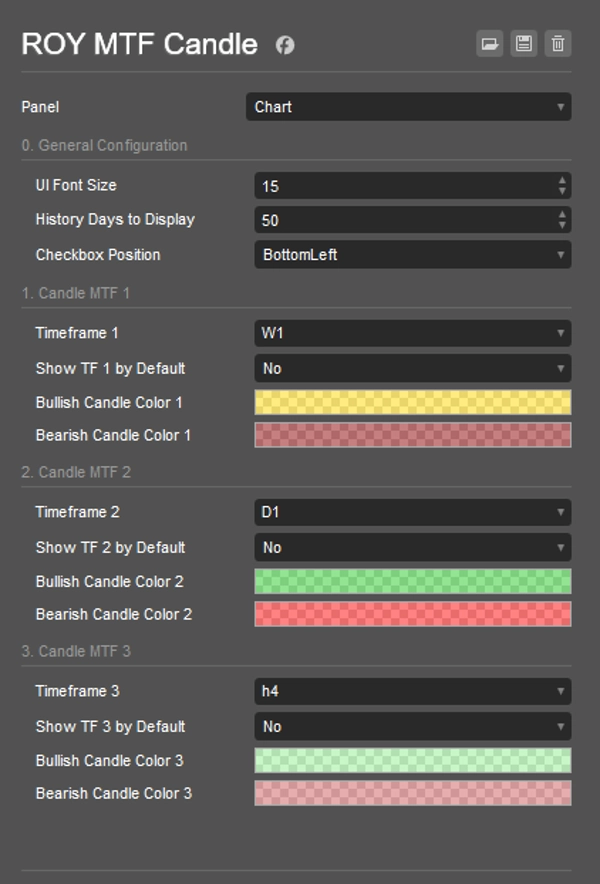
전체 매개변수 목록
- UI 글꼴 크기: 차트 내 상호작용 토글 버튼의 텍스트 크기를 조정합니다. 8에서 30 사이로 설정할 수 있습니다 (기본값: 11).
- 표시할 과거 일수: 지표가 과거 MTF 캔들을 그릴 일수입니다 (기본값: 50일).
- 체크박스 위치: UI 토글 메뉴를 차트의 어느 모서리에 고정할지 선택할 수 있습니다: 왼쪽 상단, 오른쪽 상단, 왼쪽 하단 또는 오른쪽 하단 (기본값: 왼쪽 하단).
- 시간대 1, 2, 3: 모니터링할 특정 상위 시간대입니다. (기본값은 각각 주간, 일간, 4시간입니다).
- 기본적으로 TF 1, 2, 3 표시: 지표가 차트에 적용될 때 각 시간대의 캔들이 즉시 보이는지 여부를 토글합니다 (기본값: 거짓).
- 강세/약세 캔들 색상: 세 개 시간대 각각의 상승 및 하락 캔들 색상을 완전히 사용자 정의할 수 있으며, 메인 차트를 가리지 않도록 투명도도 지원합니다.
사용 가이드
- 차트에 연결: (ViPi) MTF 캔들 지표를 활성 cTrader 작업 공간에 불러옵니다.
- 시간대 구성: 설정을 열고 현재 시간대와 함께 모니터링할 최대 세 개의 거시 시간대(예: 주간, 일간, 4시간)를 선택합니다.
- 시각적 요소 사용자 정의: 각 시간대의 강세 및 약세 캔들 색상과 투명도를 조정하여 배경과 잘 대비되도록 합니다.
- 실시간 가시성 토글: 선택한 체크박스 위치에 있는 편리한 차트 내 상호작용 버튼을 사용하여 분석 중에 특정 MTF 오버레이를 빠르게 켜거나 끌 수 있습니다.
요약
AI 요약
(ViPi) MTF Candles is a charting indicator for cTrader that overlays up to three higher timeframe (multi-timeframe, MTF) candlestick charts directly onto the current chart. This tool enables traders to analyze broader market trends, key support and resistance levels, and shifts in market sentiment without switching charts. Users can customize the displayed timeframes—commonly Weekly, Daily, and 4-hour—and adjust the number of historical days shown. The indicator includes an on-chart toggle menu, which can be positioned in any corner of the chart, allowing quick visibility control of each timeframe overlay. Visual customization options include adjustable font sizes for toggle buttons and configurable bullish/bearish candle colors with transparency settings to maintain chart clarity. This facilitates a streamlined, interactive top-down market perspective suitable for various markets including Forex, indices, commodities, stocks, and cryptocurrencies.
지표 프로필
고객 리뷰
0.0
리뷰: 0
고객 리뷰
이 상품에 대한 리뷰가 아직 없습니다. 이미 사용해 보셨나요? 다른 사람들에게 가장 먼저 소개해 주세요!
상담
자주 묻는 질문(FAQ)
BTCUSD
Forex
Indices
EURUSD
Commodities
GBPUSD
NZDUSD
Crypto
Stocks
XAUUSD
NAS100
USDJPY
트레이딩 봇, 지표, 플러그인 등 cTrader Store에서 제공되는 상품은 제3자 개발자에 의해 제공되며, 이는 단순히 정보 및 기술적 접근을 목적으로 제공된 것입니다. cTrader Store는 중개인이 아니며, 투자 조언, 개인별 추천 또는 향후 성과에 대한 어떠한 보장도 제공하지 않습니다.
이 작성자의 상품 더 보기


가격
가입일 12/06/2025
1
판매
336
무료 설치