
Head Shoulders Finder
지표
447 다운로드
버전 1.0, May 2025
Windows, Mac
5.0
리뷰: 1
설명
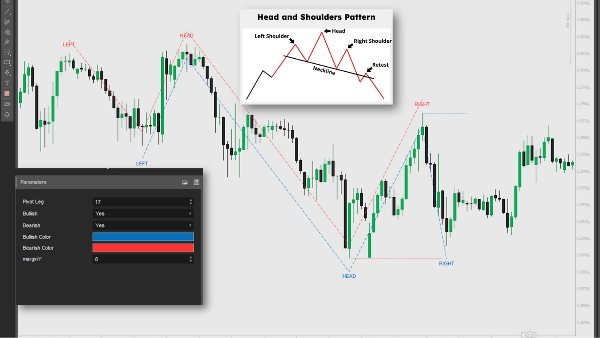
이 지표는 가격 데이터의 피벗 고점과 저점을 분석하여 헤드 앤 숄더 및 역헤드 앤 숄더 패턴을 식별합니다. 잠재적인 추세 반전을 위한 선, 라벨 및 신호를 표시하며, 가격이 넥라인 아래로 하락할 때(약세) 숏 조건을, 위로 상승할 때(강세) 롱 조건을 트리거합니다. 트레이더는 이러한 신호를 사용하여 숏 또는 롱 포지션에 진입할 수 있으며, 다른 분석 및 리스크 관리를 결합하여 거래 전략을 최적화할 수 있습니다.
요약
AI 요약
The Head Shoulders Finder is a technical indicator designed to detect Head and Shoulders and Inverted Head and Shoulders chart patterns by analyzing pivot highs and lows in price data. It visually marks these patterns with lines and labels on the price chart, highlighting potential trend reversal points. The indicator generates trading signals by identifying when the price crosses the neckline: a break below signals a bearish trend reversal suitable for short positions, while a break above indicates a bullish reversal for long positions. Traders can use these signals alongside other technical analyses and risk management strategies to inform entry decisions. This tool supports pattern recognition and signal plotting to assist in identifying potential trading opportunities based on classic reversal formations.
지표 프로필
고객 리뷰
5.0
리뷰: 1
5 | 100 % | |
4 | 0 % | |
3 | 0 % | |
2 | 0 % | |
1 | 0 % |
고객 리뷰
August 18, 2025
Automatically detects Head & Shoulders patterns, customizable visuals. Cons: No pattern reliability filter, no alerts, false signals on low TFs.
상담
자주 묻는 질문(FAQ)
트레이딩 봇, 지표, 플러그인 등 cTrader Store에서 제공되는 상품은 제3자 개발자에 의해 제공되며, 이는 단순히 정보 및 기술적 접근을 목적으로 제공된 것입니다. cTrader Store는 중개인이 아니며, 투자 조언, 개인별 추천 또는 향후 성과에 대한 어떠한 보장도 제공하지 않습니다.
이 작성자의 상품 더 보기


!["[Hamster-Coder] Pivot Points MTF" 로고](https://cdn.ctrader.com/image/webp/4c143e5a-309c-40e3-a578-f04d1e133ffa_31159)


가격
86.53M
거래량
1.97M
핍 수익
3.65K
무료 설치