Descripción
**MA Cross Signal Advanced - Indicador de Cruce de Medias Móviles**
Un indicador avanzado y práctico para identificar señales de compra y venta basadas en cruces de medias móviles en la plataforma cTrader.
### ✨ **Características Clave:**
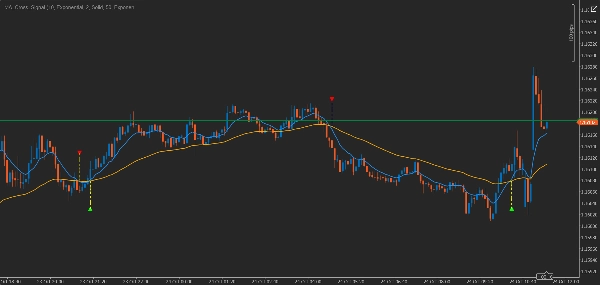
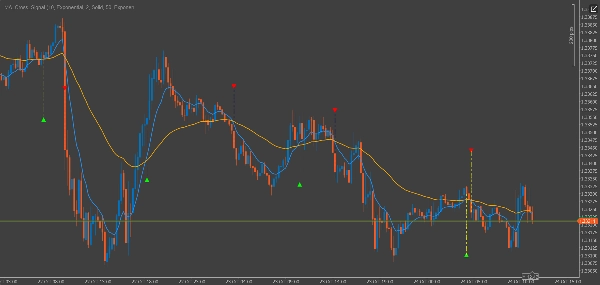
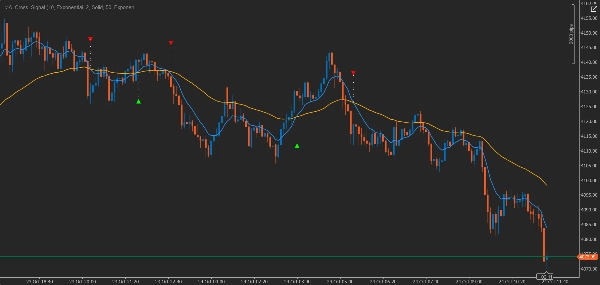
🎯 **Señales Visuales Claras**
- Flechas coloreadas en los puntos de cruce
- Señales separadas de compra (verde) y venta (rojo)
- Identificación rápida de puntos de entrada y salida
📊 **Soporte para Todos los Tipos de Medias Móviles**
- **📈 Incluye TODOS los tipos de MA disponibles en cTrader:**
- EMA (Media Móvil Exponencial)
- SMA (Media Móvil Simple)
- WMA (Media Móvil Ponderada)
- HMA (Media Móvil Hull)
- JMA (Media Móvil Jurik)
- DEMA (Media Móvil Exponencial Doble)
- TEMA (Media Móvil Exponencial Triple)
- TMA (Media Móvil Triangular)
- SMMA (Media Móvil Suavizada)
- LWMA (Media Móvil Ponderada Lineal)
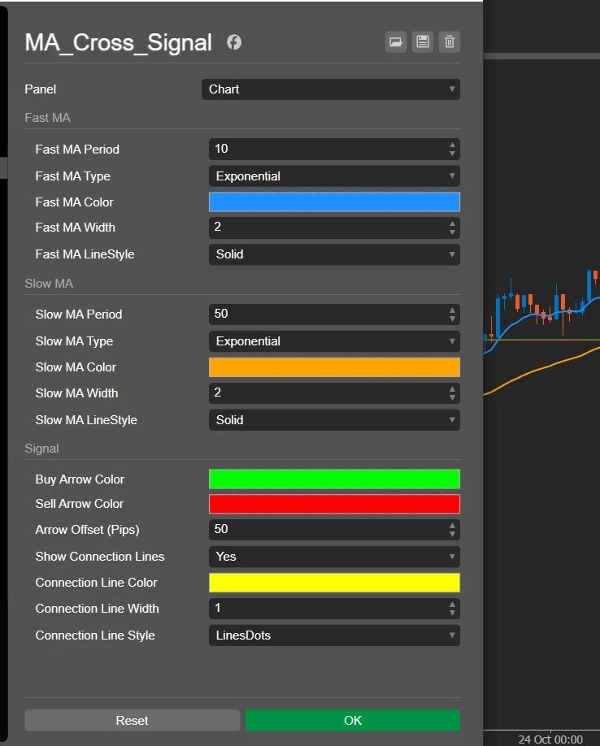
🔧 **Configuración Completa para Cada MA**
- Selección independiente del tipo de MA para líneas rápidas y lentas
- Configuraciones de período diferentes para cada MA
- Personalización completa de colores, grosor y estilo de línea
🔗 **Líneas de Conexión Inteligentes**
- Líneas visuales que conectan las flechas con los puntos reales de cruce
- Color, grosor y estilo de línea ajustables
- Ayuda a localizar con precisión los puntos de cruce
### 🛠 **Aplicaciones:**
- Identificar tendencias alcistas y bajistas
- Determinar puntos de entrada y salida del mercado
- Confirmación para otras estrategias de trading
- Análisis en múltiples marcos temporales
### ⚙ **Configuraciones Avanzadas:**
- Configuración independiente para cada MA
- Posicionamiento de flechas basado en pips
- **Selección de TODOS los tipos de medias móviles disponibles en cTrader**
- Personalización completa de colores y estilos
### 🎨 **Ventajas:**
- Interfaz simple e intuitiva
- Ejecución rápida sin demoras
- Compatible con todos los pares de divisas y marcos temporales
- **Soporte completo para TODOS los tipos de MA de cTrader**
- Capacidad para probar diferentes combinaciones de MA
Este indicador está diseñado para todos los traders, desde principiantes hasta profesionales, y con soporte para **TODOS los tipos de medias móviles disponibles en cTrader**, sirve como la herramienta ideal para el análisis técnico basado en cruces de medias móviles.
--------------------------------------------------------------------
MA Cross Signal Advanced - اندیکاتور شناسایی تقاطع میانگینهای متحرک
یک اندیکاتور پیشرفته و کاربردی برای شناسایی سیگنالهای خرید و فروش بر اساس تقاطع میانگینهای متحرک در پلتفرم cTrader.
✨ ویژگیهای اصلی:
🎯 سیگنالهای بصری واضح
- نمایش فلشهای رنگی در نقاط تقاطع
- سیگنالهای خرید (سبز) و فروش (قرمز) بهصورت مجزا
- امکان مشاهده سریع نقاط ورود و خروج
📊 پشتیبانی از تمامی انواع میانگینهای متحرک
- 📈 شامل تمام MAهای موجود در cTrader:
-
- EMA (میانگین متحرک نمایی)
- SMA (میانگین متحرک ساده)
- WMA (میانگین متحرک وزنی)
- HMA (میانگین متحرک هال)
- JMA (میانگین متحرک جان اید)
- DEMA (میانگین متحرک نمایی دوگانه)
- TEMA (میانگین متحرک نمایی سه گانه)
- TMA (میانگین متحرک مثلثی)
- SMMA (میانگین متحرک هموار شده)
- LWMA (میانگین متحرک وزنی خطی)
🔧 تنظیمات کامل برای هر MA
- انتخاب مستقل نوع MA برای هر دو خط سریع و کند
- تنظیم دورههای مختلف برای هر MA
- شخصیسازی کامل رنگ، ضخامت و سبک خط
🔗 خطوط اتصال هوشمند
- نمایش خطوط ارتباطی بین فلشها و نقاط تقاطع واقعی
- قابلیت تنظیم رنگ، ضخامت و سبک خطوط
- کمک به شناسایی دقیقتر نقاط کراس
🛠 کاربردها:
- شناسایی روندهای صعودی و نزولی
- تعیین نقاط ورود و خروج به بازار
- تأییدیه برای سایر استراتژیهای معاملاتی
- تحلیل چند timeframeی همزمان
⚙ تنظیمات پیشرفته:
- پیکربندی مستقل برای هر MA
- تنظیم موقعیت فلشها بر اساس پیپ
- انتخاب از بین تمامی انواع میانگین متحرک موجود
- شخصیسازی کامل رنگها و استایلها
🎨 مزایا:
- رابط کاربری ساده و قابل درک
- اجرای سریع و بدون تأخیر
- سازگار با تمام جفت ارزها و تایمفریمها
- پشتیبانی کامل از تمامی انواع MAهای cTrader
- امکان تست ترکیبات مختلف MAها
این اندیکاتور برای تمامی تریدرها از مبتدی تا حرفهای طراحی شده و با پشتیبانی از تمامی انواع میانگین متحرک موجود در cTrader، ابزار ایدهآلی برای تحلیل تکنیکال بر اساس تقاطع میانگینهای متحرک میباشد.
Resumen
Users can independently configure the fast and slow moving averages, selecting different MA types, periods, colors, thicknesses, and line styles. Smart connection lines visually link arrows to exact crossover points, with adjustable color and style settings to enhance precision.
MA Cross Signal is applicable for identifying bullish and bearish trends, determining market entries and exits, confirming other trading strategies, and conducting multi-timeframe analysis. It features a simple, intuitive interface and fast execution, compatible with all currency pairs and timeframes. The indicator enables testing various MA combinations, making it suitable for traders of all experience levels seeking technical analysis based on moving average crossovers.