Beschreibung
⭐ MULTI‑TIMEFRAME SMC ZONE™ 🇫🇮
Institutionelle Angebots- & Nachfragemapping über fünf Zeitrahmen — Automatisch.
Professionelles Produkt
Die Multi‑Timeframe SMC Zone Engine™ ist ein präzise entwickelter Smart Money Concepts Indikator, der institutionelle Angebots- und Nachfragezonen über fünf wichtige Zeitrahmen automatisch erkennt, zeichnet und synchronisiert — alles in Echtzeit, direkt auf Ihrem Chart.
Entwickelt für Trader, die sich auf Marktstruktur, Liquiditätsverhalten und institutionelle Fußabdrücke verlassen, eliminiert dieses Tool das Rätselraten und die Inkonsistenz manueller Zonenmarkierungen. Ob Sie intraday oder im Swing-Trading tätig sind, die Multi‑Timeframe SMC Zone Engine™ bietet Ihnen eine vollständige, mehrschichtige Karte, wo der Markt höchstwahrscheinlich reagieren wird.
Dies ist nicht nur ein Indikator.
Es ist ein Multi‑Timeframe SMC Intelligenzsystem.
Kernfähigkeiten
Automatische Erkennung von Angebots- & Nachfragezonen
Die Engine scannt die letzten X Kerzen (benutzerdefiniert) auf jedem Zeitrahmen und identifiziert:
Nachfragezonen (bullishe Ungleichgewichte)
Angebotszonen (bearishe Ungleichgewichte)
Zonen werden anhand der Kerzenstruktur validiert — wodurch sichergestellt wird, dass nur bedeutungsvolle institutionelle Fußabdrücke angezeigt werden.
Fünf Zeitrahmen, Ein Chart
Der Indikator analysiert gleichzeitig
Täglich
4H
1H
30M
15M
Jeder Zeitrahmen erhält eine einzigartige Farbe, die Ihnen eine klare, geschichtete Ansicht von höherem Zeitrahmen-Stärke und niedrigerem Zeitrahmen-Präzision bietet.
Diese Multi‑Timeframe-Fusion ist das, worauf SMC-Trader vertrauen, um Liquiditätssweeps, Mitigationsblöcke und Premium-/Discountzonen vorherzusehen.
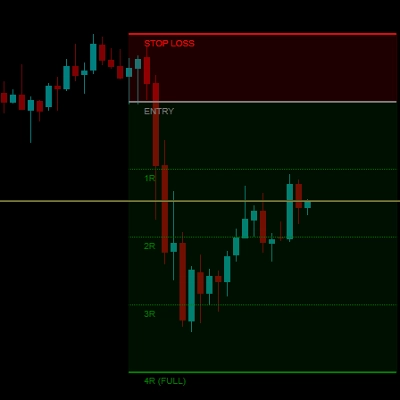
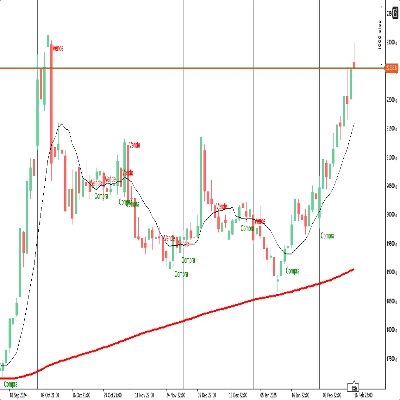
Dynamische Zonenprojektion
Jede Zone wird automatisch bis zur neuesten Kerze verlängert, sodass Sie sehen können:
Wo der Preis wahrscheinlich reagieren wird
Welche Zonen noch aktiv sind
Wie der aktuelle Preis mit institutionellen Fußabdrücken interagiert
Kein manuelles Nachzeichnen. Kein Durcheinander. Keine veralteten Zonen.
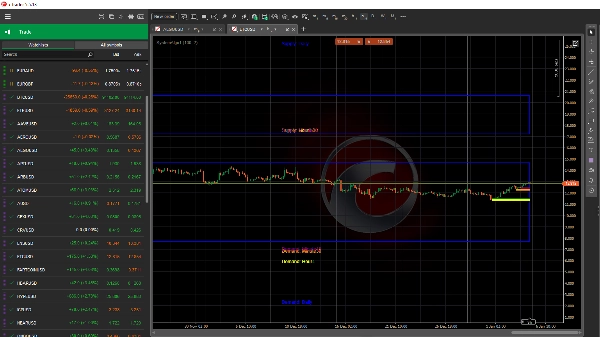
Professionelle Visualisierung
Jede Zone beinhaltet:
Ein farbiges Rechteck mit anpassbarer Rahmenbreite
Ein klares Textlabel („Nachfrage: H1“, „Angebot: M15“ usw.)
Intelligente linksverschobene Platzierung, um Überlappungen mit Kerzen zu vermeiden
Das Ergebnis ist eine saubere, lesbare, professionelle SMC-Karte.
Warum Trader es lieben
Eliminiert manuelle Zonenmarkierung
Bietet sofortigen Multi‑Timeframe-Kontext
Hilft, hochwahrscheinliche Reaktionspunkte zu identifizieren
Funktioniert mit jeder Strategie basierend auf SMC, ICT, Wyckoff oder Liquiditätskonzepten
Saubere Visualisierungen, die Ihren Chart nicht überladen
Perfekt für Intraday-Scalper und Swing-Trader
Dieses Tool gibt Ihnen die institutionelle Perspektive — ohne Komplexität.
Für wen dieser Indikator gedacht ist
Smart Money Concepts Trader
ICT-Stil Liquiditätstrader
Marktstruktur- und Orderflow-Trader
Scalper, die Präzision benötigen
Swing-Trader, die Kontext aus höheren Zeitrahmen benötigen
Jeder, der eine saubere, automatisierte Angebots-/Nachfragemap möchte
⭐ MULTI‑TIMEFRAME SMC ZONE™
Handeln Sie mit der Klarheit institutioneller Fußabdrücke — über jeden wichtigen Zeitrahmen hinweg
Hinweise
Blau = Tägliche Nachfrage/Angebot
Grün = 4H Nachfrage/Angebot
Gelb = 1H Nachfrage/Angebot
Dunkelviolett = 15 Min Nachfrage/Angebot
Pink = 5 Min Nachfrage/Angebot
Bei Überlappung > höhere Wahrscheinlichkeit für erfolgreichen Trade
Zusammenfassung
The indicator assigns unique colors to each timeframe’s zones for clear, layered visualization, enabling traders to assess higher-timeframe strength alongside lower-timeframe precision. Zones are dynamically extended to the latest candle, showing active areas where price is likely to react without manual redrawing or clutter.
Each zone is visually marked with a colored rectangle, adjustable border width, and clear text labels indicating timeframe and zone type, placed to avoid overlap with price candles. This tool supports trading strategies based on market structure, liquidity, and institutional footprints, including SMC, ICT, Wyckoff, and liquidity concepts.
SystemAlgo1 is suitable for intraday scalpers and swing traders seeking automated, multi-timeframe supply and demand mapping to identify high-probability reaction points across markets such as Forex, cryptocurrencies, indices, commodities, and stocks.