Beschreibung
Was ist eine Fair Value Gap?
Eine Fair Value Gap (FVG) ist ein mächtiges Konzept der Kursbewegung, das von institutionellen Händlern und Smart Money-Enthusiasten verwendet wird. Sie stellt ein Ungleichgewicht oder eine Ineffizienz im Markt dar, bei der sich der Preis so schnell bewegt hat, dass eine „Lücke“ entstanden ist – ein Bereich mit minimaler Handelsaktivität. Diese Lücken fungieren oft als starke Unterstützungs-/Widerstandszonen und werden häufig „gefüllt“, wenn der Preis zurückkehrt, um Liquidität zu suchen.
Dieser Indikator erkennt, verfolgt und visualisiert diese hochwahrscheinlichen Handelszonen automatisch in Ihren Charts.
Hauptmerkmale
🎯 Automatische FVG-Erkennung
- Bullische FVGs: Erkennt automatisch Aufwärtskurslücken, die oft als Unterstützungszonen dienen
- Bärische FVGs: Erkennt Abwärtskurslücken, die häufig als Widerstand fungieren
- Echtzeit-Updates: Scannt kontinuierlich die Kursbewegung, während neue Bars entstehen
- Mindestlückenfilter: Anpassbarer Filter zum Ignorieren unbedeutender Lücken (in Pips eingestellt)
📊 Visuelle Exzellenz
- Farbkodierte Zonen: Unterschiedliche Farben für bullische (grün) und bärische (rot) Lücken
- Transparenzstufen: Einstellbare Deckkraft für gefüllte vs. ungefüllte Lücken
- Saubere Beschriftungen: Klare Identifikation jedes FVG-Typs direkt im Chart
- Professionelles Design: Unaufdringliche Visualisierung, die die Chartklarheit verbessert
🎪 Hervorhebung der Einstiegszone
- Optimale Einstiegsbereiche: Markiert automatisch die besten 50 % jeder FVG für Einstiege
- Kauf-/Verkaufszonen: Deutlich beschriftete Zonen, die zeigen, wo nach Trades gesucht werden soll
- Intelligente Positionierung: Einstiegszonen für maximale Wahrscheinlichkeits-Setups positioniert
- Ein-/Ausschalten: Deaktivieren Sie Einstiegszonen, wenn Sie eine minimale Chartanzeige bevorzugen
⚡ Füllverfolgung
- Automatische Erkennung: Verfolgt, wann der Preis jede Lücke füllt (zurückkehrt)
- Visuelles Feedback: Gefüllte Lücken werden transparenter, um Unordnung zu reduzieren
- Historische Aufzeichnung: Führt eine Historie der gefüllten Lücken für Analysen
- Statusbeschriftungen: Zeigt „Gefüllt“-Tag bei abgeschlossenen Lücken
🎛️ Umfangreiche Anpassung
Anzeigeoptionen
- Nur neueste FVGs: Option, nur die neuesten Lücken anzuzeigen (reduziert Chart-Unordnung)
- Konfigurierbare Perioden: Legen Sie fest, für wie viele kürzliche Bars Lücken angezeigt werden
- Zonenerweiterung: Steuert, wie weit Zonen in die Zukunft projiziert werden
- Schriftgröße: Einstellbare Textgröße der Beschriftungen (6-20)
Visuelle Anpassung
- Benutzerdefinierte Farben: Wählen Sie beliebige Farben für bullische und bärische FVGs
- Deckkraftsteuerung: Stellen Sie Transparenz von 1-100 % ein
- Anzeige der Einstiegszonen: Ein-/Ausschalten der Einstiegszonen
- Überlappende Zonen zusammenführen: Option zum Kombinieren überlappender Zonen
Leistungsoptimierung
- Bereinigungsintervall: Konfigurieren Sie die Häufigkeit der Speicherverwaltung
- Mindestlückengröße: Filtert Lücken nach Pip-Größe
- Intelligentes Rendering: Zeichnet nur neu, wenn sich Zonen ändern (optimierte Leistung)
Handelsanwendungen
1. Support- & Resistance-Handel
- Verwenden Sie bullische FVGs als Unterstützungsniveaus für Long-Einstiege
- Verwenden Sie bärische FVGs als Widerstandsniveaus für Short-Einstiege
- Warten Sie, bis der Preis zu FVG-Zonen zurückkehrt, bevor Sie Trades eingehen
2. Trendhandel
- In Aufwärtstrends kaufen, wenn der Preis zu bullischen FVGs zurückzieht
- In Abwärtstrends verkaufen, wenn der Preis zu bärischen FVGs steigt
- Verwenden Sie FVGs als Einstiegspunkte für Trendfortsetzungen
3. Liquiditätsabgreifungen
- Identifizieren Sie, wo Market Maker zurückkehren könnten, um Orders zu füllen
- Handeln Sie das „Füllen“ signifikanter FVGs
- Kombinieren Sie mit Orderblöcken für hochwahrscheinliche Setups
4. Multi-Timeframe-Analyse
- Identifizieren Sie FVGs auf höheren Zeitrahmen (H4, D1)
- Eingehen von Trades auf niedrigeren Zeitrahmen, wenn der Preis HTF-FVGs erreicht
- Stapeln Sie mehrere Zeitrahmen-FVGs für stärkste Zonen
5. Risikomanagement
- Verwenden Sie FVG-Grenzen für die Platzierung von Stop Loss
- Zielen Sie auf gegenüberliegende FVGs für Take Profit Levels
- Größenanpassung der Positionen basierend auf der Breite der FVG-Zone
Technische Spezifikationen
Leistung
- Optimierter Algorithmus: Jeder Bar wird nur einmal verarbeitet (10-20x schneller als typische Indikatoren)
- Inkrementelles Zeichnen: Zeichnet nur geänderte Zonen neu (95 % weniger Zeichenoperationen)
- Speichereffizient: Automatische Bereinigung alter Zonen
- Skalierbar: Funktioniert effizient auf jedem Zeitrahmen und Instrument
Kompatibilität
- Zeitrahmen: Alle Zeitrahmen unterstützt (M1 bis MN)
- Instrumente: Funktioniert bei Forex, Indizes, Rohstoffen, Kryptowährungen, Aktien
- cTrader-Version: Kompatibel mit cTrader 4.x und höher
- Keine Abhängigkeiten: Eigenständiger Indikator, keine externen Bibliotheken erforderlich
Erkennungslogik
- 3-Bar-Muster: Analysiert drei aufeinanderfolgende Bars auf Lückenbildung
- Validierte Zonen: Stellt sicher, dass alle erkannten Lücken gültige obere/untere Grenzen haben
- Duplikatvermeidung: HashSet-basiertes System verhindert redundante Erkennungen
- Fehlerbehandlung: Umfassende Try-Catch-Blöcke gewährleisten Stabilität
Parameterübersicht
ParameterStandardBeschreibung
Mindestlückengröße (Pips)
2
Filtert Lücken heraus, die kleiner als dieser Wert sind
Farbe der bullischen FVG
LimeGreen
Farbe für Aufwärtslücken
Farbe der bärischen FVG
Rot
Farbe für Abwärtslücken
Deckkraft
20
Transparenzgrad (1-100)
Einstiegszonen anzeigen
True
Zeigt optimale Einstiegsbereiche an
Zonenerweiterung (Bars)
50
Wie weit Zonen nach vorne projiziert werden
Nur neueste FVGs hervorheben
True
Zeigt nur aktuelle Lücken an
Neueste Perioden
20
Anzahl der letzten Bars, für die Lücken angezeigt werden
Schriftgröße
8
Größe der Zonenbeschriftungen
Bereinigungsintervall
100
Häufigkeit der Speicherverwaltung
Überlappende Zonen zusammenführen
False
Überlappende Lücken kombinieren
Nutzungstipps
Erste Schritte
- Zum Chart hinzufügen: Ziehen Sie den Indikator auf einen beliebigen Chart
- Mindestlücke einstellen: Passen Sie sie an die Volatilität des Instruments an
-
- Forex Majors: 2-5 Pips
- Indizes: 5-10 Pips
- Krypto: 10-20 Pips
- Farben anpassen: Passen Sie sie an Ihr Chart-Thema an
- Einstiegszonen aktivieren: Einschalten für Handelsplanung
Beste Vorgehensweisen
- Mit Trend kombinieren: Handeln Sie FVGs in Richtung des größeren Trends
- Auf Konfluenz warten: Verwenden Sie sie mit Support/Resistance oder gleitenden Durchschnitten
- Respektieren Sie die Zone: Jagen Sie dem Preis nicht hinterher, warten Sie, bis er zur FVG zurückkehrt
- Höhere Zeitrahmen zuerst: Prüfen Sie HTF-FVGs, bevor Sie auf LTF einsteigen
- Ergebnisse protokollieren: Verfolgen Sie, welche FVG-Setups für Sie am besten funktionieren
Empfohlene Zeitrahmen
- Scalping (M1-M5): Verwenden Sie Neueste Perioden = 10-15
- Day Trading (M15-H1): Verwenden Sie Neueste Perioden = 20-30
- Swing Trading (H4-D1): Verwenden Sie Neueste Perioden = 30-50
- Positionshandel (W1-MN): Zeigt alle FVGs (Nur Neueste = False)
Instrumentenspezifische Einstellungen
Forex-Paare:
- Minimale Lückengröße: 2-5 Pips
- Zonenerweiterung: 50 Bars
- Funktioniert am besten bei Majors (EUR/USD, GBP/USD)
Aktienindizes:
- Minimale Lückengröße: 5-10 Pips
- Zonenerweiterung: 30-50 Bars
- Ausgezeichnet bei US30, SPX500, NAS100
Kryptowährungen:
- Minimale Lückengröße: 10-20 Pips
- Zonenerweiterung: 40-60 Bars
- Hohe Volatilität erzeugt viele FVGs
Rohstoffe:
- Minimale Lückengröße: 5-10 Pips
- Zonenerweiterung: 50 Bars
- Funktioniert gut bei XAUUSD (Gold)
Was macht diesen Indikator einzigartig?
✅ Genaues Erkennungsalgorithmus
Im Gegensatz zu vielen FVG-Indikatoren, die falsche Logik verwenden, nutzt dieser Indikator das korrekte 3-Bar-Muster:
- Bullische FVG: Lücke zwischen dem Hoch von Bar 1 und dem Tief von Bar 3
- Bärische FVG: Lücke zwischen dem Tief von Bar 1 und dem Hoch von Bar 3
- Validierte Zonen mit Garantie, dass oben > unten ist
✅ Leistungsoptimiert
Von Grund auf für Geschwindigkeit entwickelt:
- Keine redundanten Berechnungen
- Inkrementelles Zeichnungssystem
- Intelligente Speicherverwaltung
- Verarbeitet Tausende Bars effizient
✅ Professionelle Qualität
- Sauberer, lesbarer Code
- Umfassende Fehlerbehandlung
- Detaillierte Protokollierung zur Fehlerbehebung
- Regelmäßige Updates und Support
✅ Händlerorientierte Funktionen
- Einstiegszonen zeigen, wo gehandelt werden soll
- Füllverfolgung reduziert Verwirrung
- Anpassbar für jede Strategie
- Funktioniert auf allen Instrumenten/Zeitfenstern
Häufig gestellte Fragen
F: Wie viele FVGs erscheinen auf meinem Chart? A: Hängt vom Zeitrahmen und der Volatilität ab. Typischerweise 5-15 aktive Zonen. Verwenden Sie „Nur Neueste hervorheben“, um die Anzeige zu steuern.
F: Warum verschwinden einige FVGs? A: Wenn Zonen gefüllt sind oder die Bereinigungsperiode überschreiten, werden sie entfernt, um Unordnung zu reduzieren. Passen Sie „Neueste Perioden“ an, um sie länger zu behalten.
F: Kann ich dies für automatisierten Handel verwenden? A: Dies ist ein Indikator für visuelle Analyse. Für automatisierten Handel müssten Sie einen cBot erstellen, der die FVG-Daten liest.
F: Repaintet der Indikator? A: Nein. Sobald ein Bar schließt und eine FVG erkannt wird, bleibt sie fixiert. Nur die potenzielle FVG des aktuell entstehenden Bars kann sich vor dem Schließen ändern.
F: Welcher Zeitrahmen ist am besten? A: H1 und H4 funktionieren gut für die meisten Händler. Höhere Zeitrahmen (D1, W1) zeigen stärkere, bedeutendere FVGs.
F: Wie erkenne ich, welche FVGs ich handeln soll? A: Konzentrieren Sie sich auf FVGs, die mit dem größeren Trend übereinstimmen, dem aktuellen Preis am nächsten sind und Konfluenz mit anderen technischen Faktoren aufweisen.
Support & Updates
- Dokumentation: Umfassendes Benutzerhandbuch enthalten
- Regelmäßige Updates: Kontinuierliche Verbesserung und Optimierung
- Fehlerbehebungen: Schnelle Reaktion auf Probleme
- Feature-Anfragen: Offen für Benutzerwünsche
Bildungsressourcen
Empfohlenes Lernen
- Studieren Sie ICT (Inner Circle Trader) Konzepte
- Lernen Sie Smart Money Konzepte (SMC)
- Verstehen Sie Marktstruktur und Liquidität
- Üben Sie zunächst manuelles Erkennen von FVGs
Praxisansatz
- Visuelles Training: Erkennen Sie FVGs manuell, bevor Sie den Indikator verwenden
- Backtest: Überprüfen Sie historische FVGs und deren Füllraten
- Demo-Test: Üben Sie risikofreies Handeln mit FVG-Setups
- Aufzeichnungen führen: Protokollieren Sie, welche Setups für Ihre Strategie funktionieren
Installation
- Laden Sie die
FairValueGapIndicator.csDatei herunter - Öffnen Sie cTrader
- Gehen Sie zu Automate → Indikatoren
- Klicken Sie auf „+“, um einen neuen Indikator hinzuzufügen
- Wählen Sie die heruntergeladene Datei aus
- Klicken Sie auf „Build“
- Ziehen Sie den Indikator auf das Chart
Haftungsausschluss
Dieser Indikator ist ein Werkzeug für die technische Analyse und garantiert keine profitablen Trades. Alle Handelsaktivitäten bergen Risiken. Die vergangene Performance der identifizierten FVGs garantiert keine zukünftigen Ergebnisse. Verwenden Sie stets ein angemessenes Risikomanagement, halten Sie eine passende Positionsgröße ein und riskieren Sie niemals mehr, als Sie sich leisten können zu verlieren. Dieses Werkzeug sollte Teil einer umfassenden Handelsstrategie sein und nicht isoliert verwendet werden.
Versionsinformationen
Aktuelle Version: 2.0 Zuletzt aktualisiert: Dezember 2024 Kompatibilität: cTrader 4.x+ Lizenz: Kostenlos für den persönlichen Gebrauch
Tags
Fair Value Gap, FVG, Smart Money, ICT, Order Flow, Support Resistance, Price Action, Liquidität, Ungleichgewicht, Handelszonen, Marktstruktur, institutioneller Handel, Angebot Nachfrage, Einstiegssignale
Empfohlene Screenshots
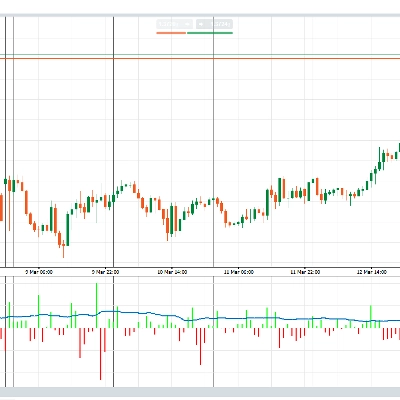
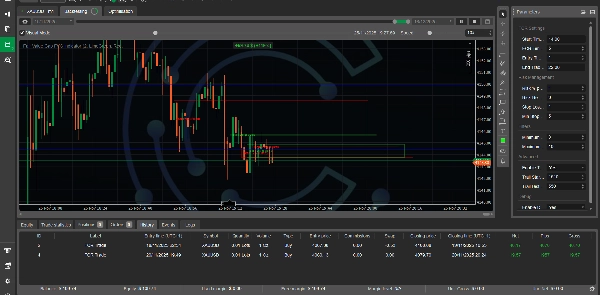
- Hauptchart-Ansicht: Zeigt mehrere FVGs mit Einstiegszonen
- Beispiel für bullische FVG: Klarer Aufwärtstrend mit FVG-Unterstützung
- Beispiel für bärische FVG: Abwärtstrend mit FVG-Widerstand
- Füllerkennung: Zeigt Vorher/Nachher von gefüllten FVGs
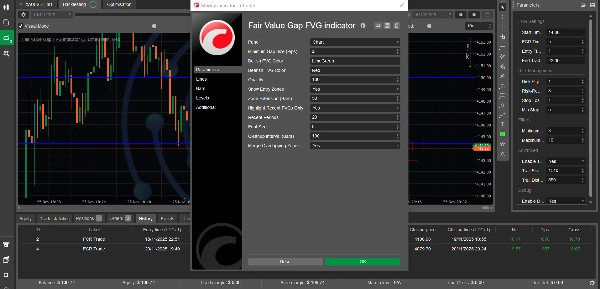
- Parameter-Panel: Anzeigeanpassungsoptionen
- Multi-Timeframe: Dasselbe Instrument auf verschiedenen Zeitrahmen
Änderungsprotokoll
Version 2.0 (Dezember 2024)
- ✅ Kritischen FVG-Erkennungsalgorithmus behoben
- ✅ Leistungsoptimierungen implementiert (10-20x schneller)
- ✅ Inkrementelles Zeichnungssystem hinzugefügt (95 % weniger Neuzeichnungen)
- ✅ Verbesserte Fehlerbehandlung und Stabilität
- ✅ Option zum Zusammenführen überlappender Zonen hinzugefügt
- ✅ Verbesserte Protokollierung und Debugging
- ✅ Optimierte Speicherverwaltung
- ✅ Umfassende Validierung hinzugefügt
Version 1.0 (Erstveröffentlichung)
- Grundlegende FVG-Erkennung
- Farbkodierte Zonen
- Hervorhebung der Einstiegszone
- Füllverfolgung
Zusammenfassung
Designed for use on all timeframes and instruments—including Forex, indices, commodities, cryptocurrencies, and stocks—it supports multi-timeframe analysis and offers extensive customization of display options such as gap size filters, zone extension, colors, opacity, and label fonts. Performance optimizations ensure efficient operation with minimal redraws and memory use.
Traders can apply the indicator for support/resistance trading, trend continuation entries, liquidity grabs, and risk management by using FVG boundaries for stop loss and take profit placement. The tool is compatible with cTrader 4.x and above and functions as a standalone indicator without external dependencies. It does not repaint and maintains a historical record of gaps for analysis.
Kundenbewertungen
5 | 50 % | |
4 | 50 % | |
3 | 0 % | |
2 | 0 % | |
1 | 0 % |