
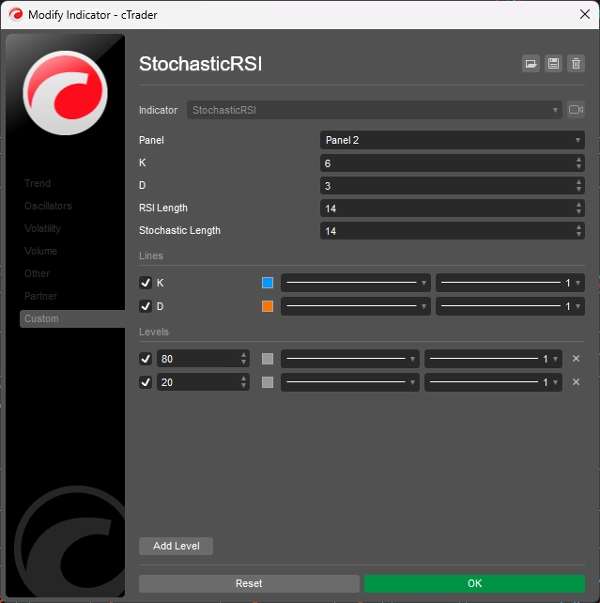
StochasticRSI
Indikator
1.16K downloads
Version 1.0, Nov 2024
Windows, Mac
5.0
Bewertungen: 1
Beschreibung
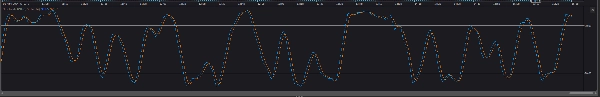
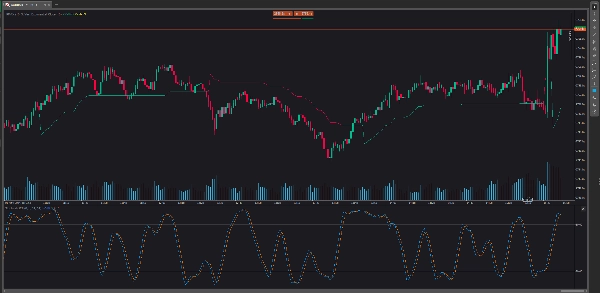
Stochastischer RSI (StochRSI) ist ein technischer Analyseindikator, der zur Unterstützung der Aktienmarktprognose verwendet wird, indem er die Preisspanne eines Wertpapiers mit seinem Schlusskurs vergleicht. StochRSI ist einzigartig, da er sich auf die Marktbewegung konzentriert und gut darin ist, überkaufte und überverkaufte Marktbedingungen zu erkennen. StochRSI unterscheidet sich von anderen technischen Indikatoren, wie dem Relative Strength Index (RSI), da er schneller von überkauften zu überverkauften Preisen wechselt als der RSI.
Zusammenfassung
Indikatorprofil
Kundenbewertungen
5.0
Bewertungen: 1
5 | 100 % | |
4 | 0 % | |
3 | 0 % | |
2 | 0 % | |
1 | 0 % |
Kundenbewertungen
July 9, 2025
Pros: Combines Stochastic Oscillator and RSI for improved overbought/oversold detection. Easy to set up, stable on all timeframes. Cons: No tooltips or alerts. Requires confirmation from trend indicators to avoid false signals. Limited customization options.
Diskussion
Häufig gestellte Fragen (FAQ)
Indices
RSI
Über den cTrader Store verfügbare Produkte, einschließlich Handelsbots, Indikatoren und Plugins, werden von externen Entwicklern bereitgestellt und nur zu Informations- und technischen Zugriffszwecken verfügbar gemacht. cTrader Store ist kein Broker und erbringt keine Anlageberatung, persönlichen Empfehlungen oder eine Garantie für zukünftige Performance.
Mehr von diesem Autor


Preis
2
Verkäufe
6.9K
Kostenlose Installationen