
Beschreibung
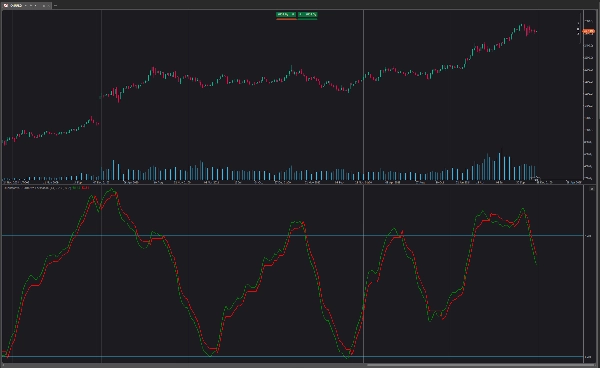
Der QQE (Quantitative Qualitative Estimation) Weighted Oscillator verbessert seine ursprüngliche Version, indem er den RSI basierend auf den Signalen des Trailing Stops gewichtet, was mehr Aufwand erfordert, damit ein Kreuz mit dem Trailing Stop auftritt. Der QQE Weighted Oscillator besteht aus einem geglätteten RSI-Oszillator und einem Trailing Stop, der aus demselben RSI abgeleitet wird.
Der Oszillator kann verwendet werden, um anzuzeigen, ob der Markt überkauft/überverkauft ist, sowie als frühe Anzeige von Trendwenden dank der führenden Natur des RSI.
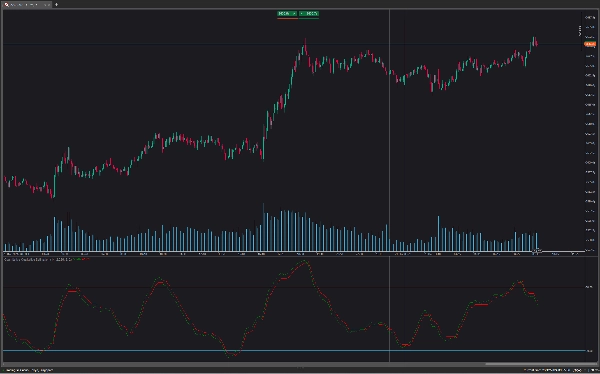
Die Verwendung höherer Factor Werte liefert einen längerfristigen Trailing Stop.
Wie beim regulären RSI kann eine Divergenz auf eine Umkehr hinweisen.
Eine weitere Gewichtung steuert, wie viel "Aufwand" erforderlich ist, damit der Trailing Stop den RSI kreuzt. Zum Beispiel erfordert ein RSI über dem Trailing Stop bei Verwendung höherer Gewichtungen stärkere negative Kursbewegungen, damit ein potenzielles Kreuz auftreten kann.
Dies kann dazu führen, dass höhere Gewichtungen zyklischere und glattere Ergebnisse liefern.
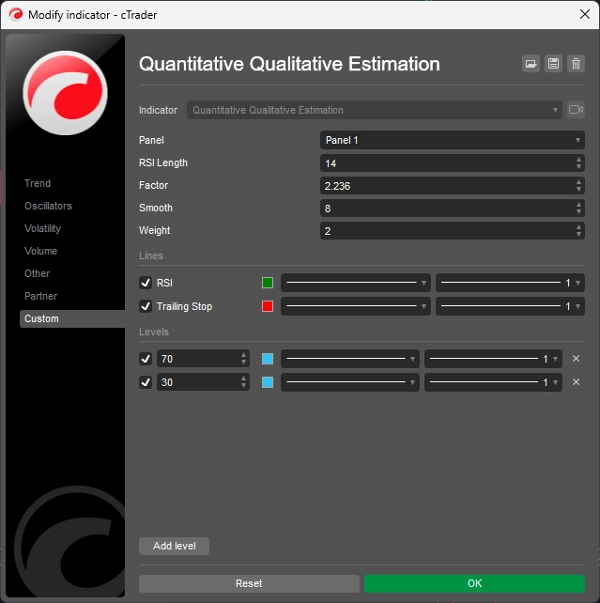
So ändern Sie die Einstellungen:
- Length: Länge des RSI-Oszillators.
- Factor: Multiplikativer Faktor, der für die Berechnung des Trailing Stops verwendet wird.
- Smooth: Glättungsgrad des RSI-Oszillators.
- Weight: Gewichtungsgrad, der für die RSI-Berechnung verwendet wird.
Zusammenfassung
Kundenbewertungen
5 | 100 % | |
4 | 0 % | |
3 | 0 % | |
2 | 0 % | |
1 | 0 % |


