present
Registrieren Sie sich und erhalten Sie $50 Rabatt auf Ihren ersten Kauf
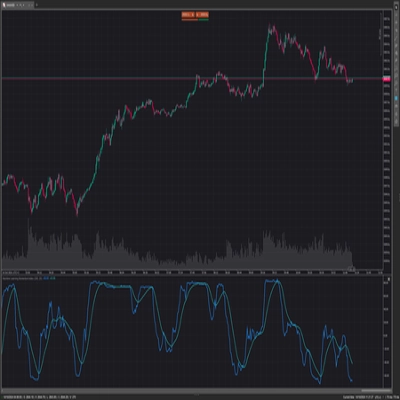
Trading product for Machine Learning Momentum Index Indikator Indices AI, image 1
Machine Learning Momentum Index
4.5
Bewertungen: 2
2
Verkäufe
7.3K
Kostenlose Installationen

Beschreibung

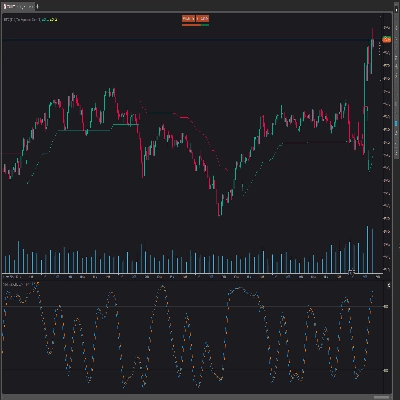
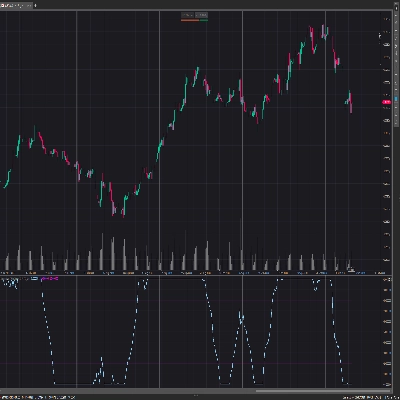
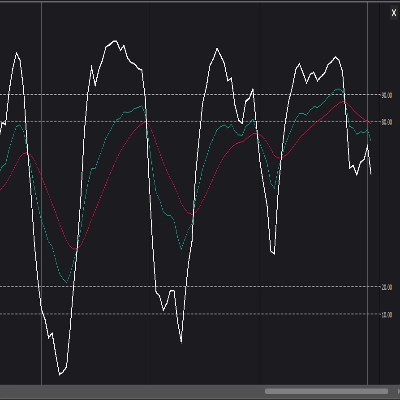
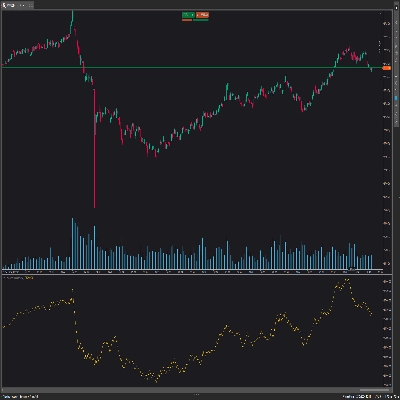
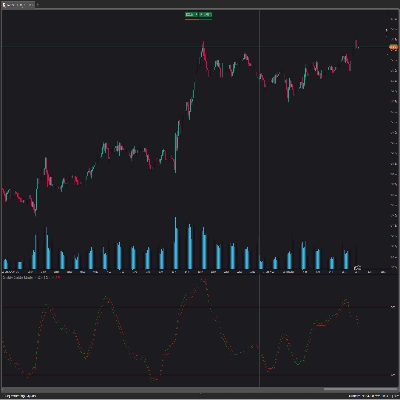
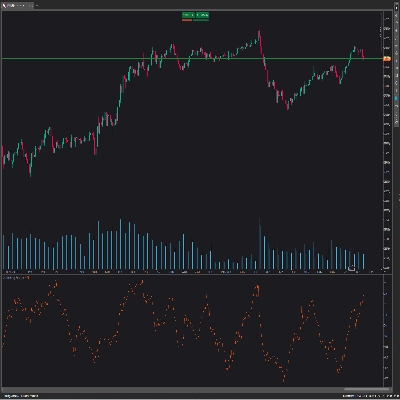
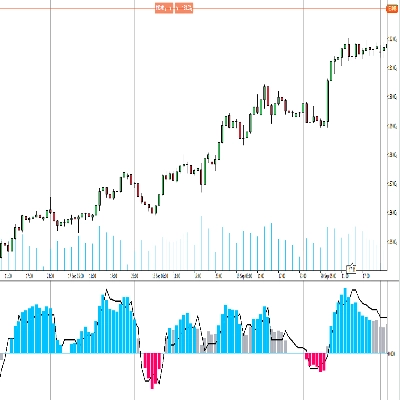
Der Machine Learning Momentum Index (MLMI) stellt den nächsten Schritt im Oszillatorhandel dar. Durch die Kombination traditioneller Momentum-Analyse mit maschinellem Lernen bietet der MLMI ein kraftvolles und dynamisches Werkzeug, das den Komplexitäten moderner Finanzlandschaften gerecht wird. Er bietet Händlern eine adaptive Möglichkeit, das Marktmomentum und Trends zu verstehen und darauf zu reagieren, und liefert Echtzeiteinblicke in das Marktmomentum und vorherrschende Trends

Zusammenfassung

KI-Zusammenfassung
The Machine Learning Momentum Index (MLMI) is an advanced oscillator that integrates traditional momentum analysis with machine learning techniques. Designed to provide real-time insights, MLMI helps traders assess market momentum and identify prevailing trends dynamically. By adapting to the complexities of modern financial markets, this indicator offers an enhanced approach to momentum trading. It is applicable across various indices, including Nasdaq, S&P 500, DAX, and Dow, supporting traders in making informed decisions based on evolving market conditions.
Indikatorprofil

Diskussion

Kundenbewertungen

4.5
Bewertungen: 2
5
50 %
4
50 %
3
0 %
2
0 %
1
0 %
Kundenbewertungen
July 9, 2025
Pros: Combines RSI-based WMAs and k‑NN machine learning for adaptive momentum detection. Highlights trend changes and consolidation zones. Cons: No alerts or tooltips. Less effective on higher timeframes. Requires other confirmation tools to trade reliably.
April 26, 2025
Accuracy

Häufig gestellte Fragen (FAQ)

Indices
AI
Über den cTrader Store verfügbare Produkte, einschließlich Handelsbots, Indikatoren und Plugins, werden von externen Entwicklern bereitgestellt und nur zu Informations- und technischen Zugriffszwecken verfügbar gemacht. cTrader Store ist kein Broker und erbringt keine Anlageberatung, persönlichen Empfehlungen oder eine Garantie für zukünftige Performance.

Mehr von diesem Autor
„PMAX“-Logo
5.0
(6)
Kostenlos
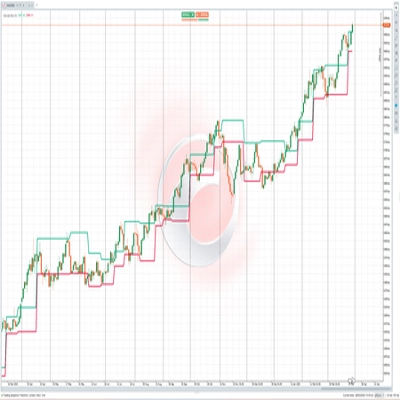
It's a combination of two trailing stop loss and the other one is well-known ATR-based SuperTrend.
Stochastic RSI (StochRSI) is a technical indicator used to measure the strength and weakness of the RSI.
Laguerre RSI is based on John EHLERS' Laguerre Filter to avoid the noise of RSI.
The KDJ oscillator display consists of 3 lines (K, D and J - hence the name of the display) and 2 levels.
The Darvas Box involves identifying "boxes" or trading ranges where a stock's price consolidates before breaking out.
On Balance Volume (OBV) measures buying and selling pressure as a cumulative indicator.
The Ichimoku Cloud is a comprehensive technical analysis system developed by Japanese journalist Goichi Hosoda
The QQE (Quantitative Qualitative Estimation) Weighted Oscillator improves its original version by weighting the RSI.
Chaikin money flow's primary purpose is to distinguish between periods of accumulation and distribution of a security.

Das könnte Sie auch noch interessieren

Explore 88 harmonic price-pattern variants with interactive chart controls and geometric reference levels.
Instantly spot high-liquidity institutional moves with clean, non-obtrusive triangle alerts on cTrader charts.
Marks liquidity zones at swing highs/lows, tracks touches, and confirms breaks to improve entries and structure clarity.
Clean psychological round-number grid with native pip and point auto-scaling across Forex, Gold, Indices, and Crypto.
Trend-filtered signals, transparent trade plans and a multi-timeframe decision panel for cTrader.
MA-RSI HTF Confirmation: Eliminate false signals and trade with confidence!
Order block
ZigZag Pro – Multi-Swing Indicator for cTrader Description: ZigZag Pro is a powerful and fully customizable swing indica
Flags breakouts of recent highs/lows on cTrader charts. Shows arrows/lines. Optional trend filter & sound alerts 📉📈
Unlock trading precision with QQE! Dual QQE indicators with a Bollinger Bands zero line provide clear buy/sell signals.
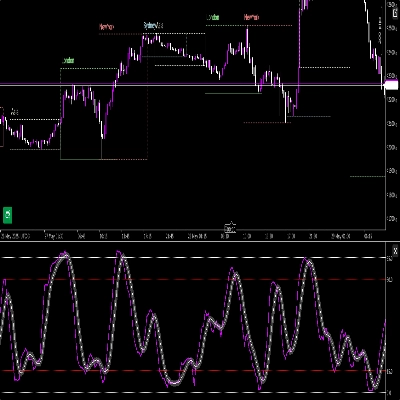
Indicator Stochastic With RSI
Angora Pattern Recognition is a cTrader indicator that finds, draws and tracks classic chart patterns automatically.
Shows the Pips of your open trade in real time with a clear and customizable display. Rosario, Argentina Julio 28, 2026.
MMXM Structure by LudwigICT – Professional Market Structure Mapping Tool
Customizable window inside your platform, access to any website Calendar
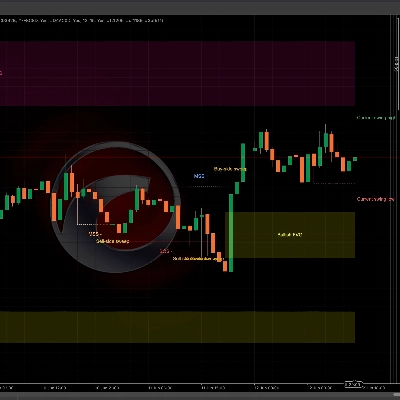
WinSMC is an overlay SMC indicator for cTrader. It helps you visually identify!
Half Trend – Trend Reversal Indicator for cTrader
Multi VWAP. Three timeframes. One clean chart. Your Essential Trading Tool.

Preis

2
Verkäufe
7.3K
Kostenlose Installationen