
Laguerre RSI
Gösterge
647 i̇ndirmeler
Sürüm 1.0, Oct 2024
Windows, Mac
5.0
Değerlendirmeler: 1
Açıklama
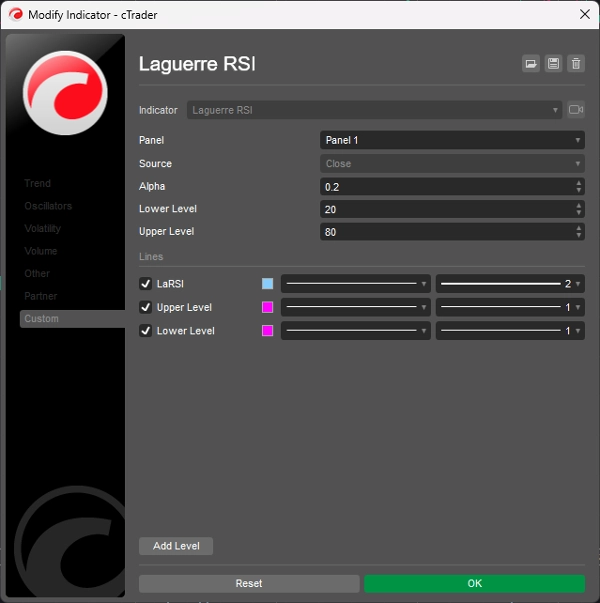
Laguerre RSI, RSI'nin gürültüsünü önlemek için John EHLERS'ın Laguerre Filtresi'ne dayanır.
Gecikme ve yumuşaklığı artırmak/azaltmak için alfa katsayısını değiştirin.
the
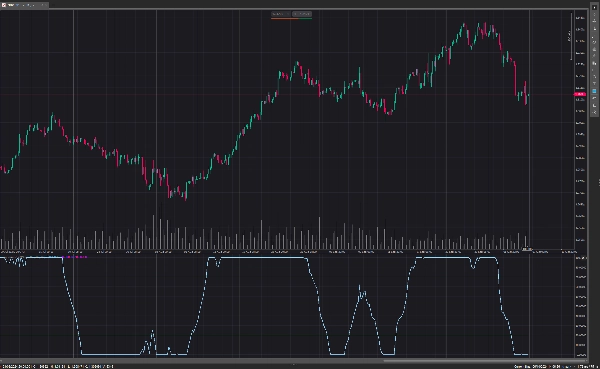
Laguerre RSI 20'nin üzerine yukarı doğru geçtiğinde alım yapın.
Laguerre RSI 80'in altına aşağı doğru geçtiğinde satış yapın.
Gösterge 80'in üzerinde yatay seyrederken, yükseliş trendi güçlüdür.
Gösterge 20 seviyesinin altında yatay seyrederken, düşüş trendinin güçlü olduğu anlamına gelir.
Özet
Gösterge profili
Müşteri değerlendirmeleri
5.0
Değerlendirmeler: 1
5 | 100 % | |
4 | 0 % | |
3 | 0 % | |
2 | 0 % | |
1 | 0 % |
Müşteri değerlendirmeleri
July 14, 2025
Pros: Smooths RSI using Laguerre filter, reducing noise and lag. Clear overbought/oversold levels. Great for scalping. Cons: No alerts or tooltips. Requires confirmation with trend filters. Lacks setting templates and advanced features.
Tartışma
SSS
RSI
cTrader Store üzerinden erişilebilen işlem botları, göstergeler ve eklentiler gibi ürünler, üçüncü taraf sağlayıcılar tarafından sağlanır ve yalnızca bilgilendirme ve teknik erişim amaçlarıyla sunulur. cTrader Store bir broker değildir ve yatırım tavsiyesi, kişisel öneriler vermez veya gelecekteki performansı garanti etmez.
Bu oluşturanın diğer ürünleri


Fiyat
2
Satışlar
6.9K
Ücretsiz yüklemeler