Opis
Kompleksowy przewodnik po analizie Ichimoku Cloud
Historia i tło
Ichimoku Kinko Hyo (lub Ichimoku Cloud) został opracowany przez japońskiego dziennikarza Goichi Hosodę pod koniec lat 30. XX wieku. Po latach badań i testów wstecznych z zespołem asystentów, Hosoda opublikował swoje odkrycia w 1969 roku. Nazwa "Ichimoku Kinko Hyo" tłumaczy się jako "wykres równowagi na pierwszy rzut oka", co odzwierciedla jego zamierzony cel: umożliwić traderom szybkie ocenienie wielu aspektów działania rynku w jednym widoku.
Innowacja Hosody była niezwykła, ponieważ stworzył ten złożony system na dekady przed pojawieniem się analizy komputerowej, wykonując wszystkie obliczenia ręcznie. To, co wyróżnia system Ichimoku, to jego holistyczne podejście, integrujące wiele ram czasowych i wymiarów analizy rynku w jedną spójną strukturę.
Pięć składników Ichimoku Cloud
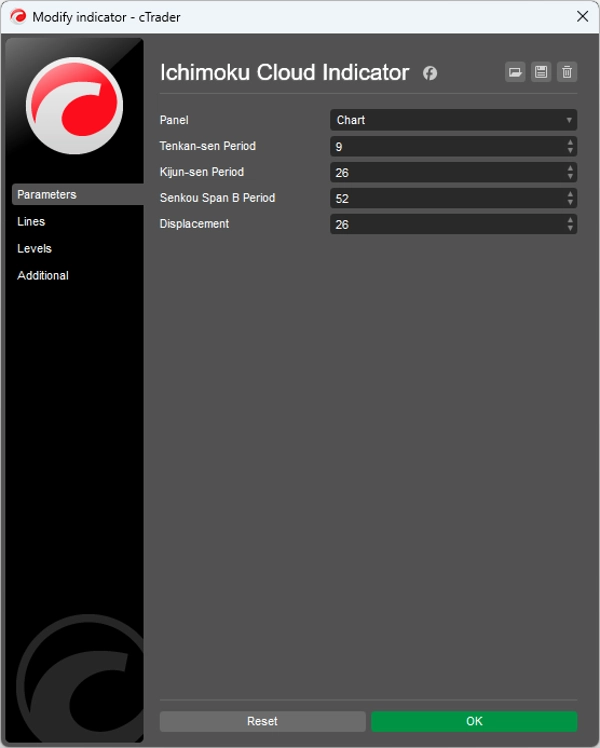
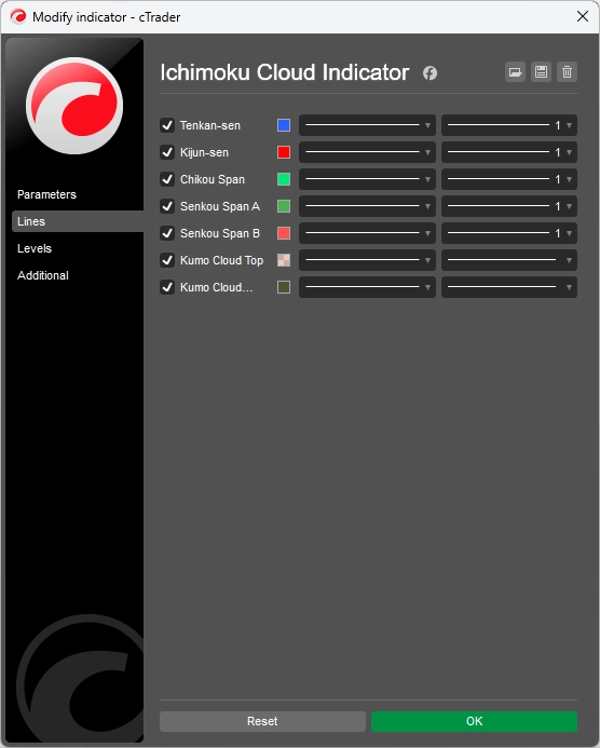
Ichimoku Cloud składa się z pięciu odrębnych linii, z których każda dostarcza specyficznych informacji:
1. Tenkan-sen (Linia konwersji)
- Obliczenia: (Najwyższy szczyt + Najniższy dołek) / 2 z ostatnich 9 okresów
- Funkcja: Reprezentuje krótkoterminowy impet rynku
- Interpretacja: Działa jako dynamiczny poziom wsparcia/oporu oraz wskaźnik trendu
2. Kijun-sen (Linia bazowa)
- Obliczenia: (Najwyższy szczyt + Najniższy dołek) / 2 z ostatnich 26 okresów
- Funkcja: Reprezentuje średnioterminowy impet rynku
- Interpretacja: Działa jako silniejszy poziom wsparcia/oporu i może służyć jako trailing stop
3. Senkou Span A (Wiodąca linia A)
- Obliczenia: (Tenkan-sen + Kijun-sen) / 2, wykreślona 26 okresów do przodu
- Funkcja: Tworzy wiodącą krawędź chmury (Kumo)
- Interpretacja: Prognozowany poziom wsparcia/oporu
4. Senkou Span B (Wiodąca linia B)
- Obliczenia: (Najwyższy szczyt + Najniższy dołek) / 2 z ostatnich 52 okresów, wykreślona 26 okresów do przodu
- Funkcja: Tworzy tylną krawędź chmury (Kumo)
- Interpretacja: Prognozowany poziom wsparcia/oporu
5. Chikou Span (Linia opóźniona)
- Obliczenia: Aktualna cena zamknięcia, wykreślona 26 okresów wstecz
- Funkcja: Potwierdza trendy i identyfikuje potencjalne odwrócenia
- Interpretacja: Gdy jest powyżej ceny, sygnał byczy; gdy poniżej, niedźwiedzi
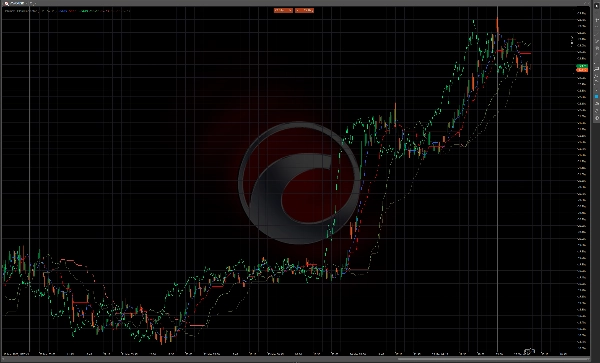
Kumo (Chmura)
Obszar pomiędzy Senkou Span A a Senkou Span B nazywany jest "Kumo" lub chmurą. Chmura reprezentuje potencjalne strefy wsparcia i oporu, a jej grubość wskazuje na zmienność rynku oraz siłę tych stref.
- Gruba chmura: Silne wsparcie/opór, wyższa zmienność
- Cienka chmura: Słabsze wsparcie/opór, niższa zmienność
- Bycza chmura: Senkou Span A powyżej Senkou Span B (często zielona)
- Niedźwiedzia chmura: Senkou Span B powyżej Senkou Span A (często czerwona)
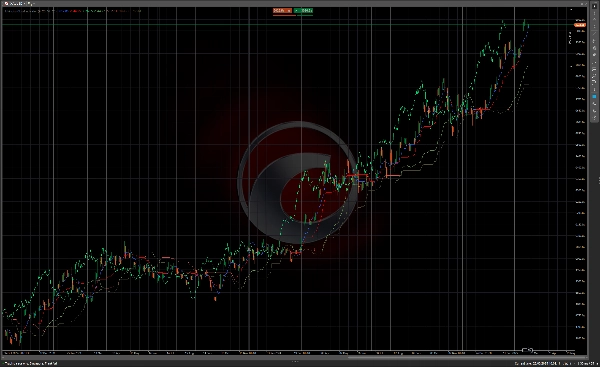
Zasady i sygnały handlowe
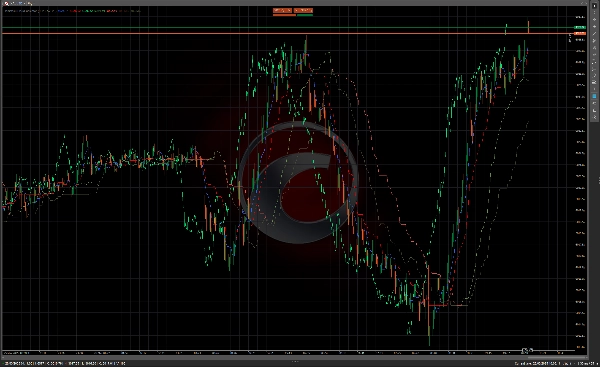
Określenie trendu
- Kryteria trendu byczego:
-
- Cena jest powyżej chmury
- Tenkan-sen jest powyżej Kijun-sen
- Chikou Span jest powyżej ceny sprzed 26 okresów
- Senkou Span A rośnie i jest powyżej Senkou Span B (bycza chmura)
- Kryteria trendu niedźwiedziego:
-
- Cena jest poniżej chmury
- Tenkan-sen jest poniżej Kijun-sen
- Chikou Span jest poniżej ceny sprzed 26 okresów
- Senkou Span A spada i jest poniżej Senkou Span B (niedźwiedzia chmura)
- Rynek neutralny/zakresowy:
-
- Cena znajduje się w obrębie chmury
- Tenkan-sen i Kijun-sen są płaskie lub często się przecinają
Sygnały wejścia
Bycze sygnały wejścia
- TK Cross (Przecięcie Tenkan/Kijun):
-
- Tenkan-sen przecina się powyżej Kijun-sen
- Najskuteczniejsze, gdy cena jest powyżej chmury
- Silniejszy sygnał, gdy chmura jest bycza
- Przebicie Kumo:
-
- Cena przebija się powyżej chmury po byciu pod nią lub w jej obrębie
- Silniejszy sygnał, gdy chmura przed nami jest bycza (Senkou Span A > Senkou Span B)
- Potwierdzenie Chikou Span:
-
- Chikou Span przecina się powyżej ceny sprzed 26 okresów
- Brak oporu przed Chikou Span
Niedźwiedzie sygnały wejścia
- TK Cross (Niedźwiedzi):
-
- Tenkan-sen przecina się poniżej Kijun-sen
- Najskuteczniejsze, gdy cena jest poniżej chmury
- Silniejszy sygnał, gdy chmura jest niedźwiedzia
- Przebicie Kumo (Niedźwiedzie):
-
- Cena przebija się poniżej chmury po byciu powyżej lub w jej obrębie
- Silniejszy sygnał, gdy chmura przed nami jest niedźwiedzia (Senkou Span B > Senkou Span A)
- Potwierdzenie Chikou Span (Niedźwiedzie):
-
- Chikou Span przecina się poniżej ceny sprzed 26 okresów
- Brak wsparcia przed Chikou Span
Sygnały wyjścia
- Odwrócenie trendu: Gdy zaczynają pojawiać się kryteria przeciwnego trendu
- TK Cross: Gdy Tenkan-sen przecina Kijun-sen w przeciwnym kierunku
- Dotknięcie chmury: Gdy cena dotyka przeciwnej strony chmury
- Ostrzeżenie Chikou Span: Gdy Chikou Span zbliża się do historycznych poziomów cen
Poziomy wsparcia i oporu
- Bezpośrednie wsparcie/opór: Tenkan-sen i Kijun-sen
- Średnioterminowe wsparcie/opór: Chmura (silniejsza na płaskich odcinkach)
- Kumo Twist: Gdy Senkou Span A i B się przecinają, tworząc potencjalne punkty odwrócenia
Zaawansowane techniki Ichimoku
1. Kumo Twist (Skręt chmury)
Kumo Twist występuje, gdy Senkou Span A i B się przecinają, tworząc potencjalny punkt odwrócenia 26 okresów w przyszłość. Traderzy często używają tego jako wczesnego sygnału ostrzegawczego o możliwych zmianach trendu.
2. Analiza ram czasowych
Wielu traderów Ichimoku analizuje wiele ram czasowych:
- Wyższa ramka czasowa dla ogólnego kierunku trendu
- Średnia ramka czasowa dla sygnałów wejścia
- Niższa ramka czasowa dla precyzyjnego momentu wejścia
3. Poszerzanie/zwężanie Senkou Span
- Poszerzająca się chmura: Rosnąca zmienność rynku, silniejszy trend
- Zwężająca się chmura: Malejąca zmienność, potencjalne osłabienie trendu
4. Płaska Kumo (Płaska chmura)
Gdy oba Senkou Spany biegną równolegle, często wskazuje to na silny trend z wyraźnymi poziomami wsparcia/oporu.
Praktyczne zastosowania
Idealne warunki rynkowe
Ichimoku Cloud działa najlepiej na rynkach trendowych i we wszystkich ramach czasowych. Można go stosować do:
- Forex
- Akcje
- Surowce
- Kryptowaluty
- Indeksy
Zarządzanie ryzykiem
- Używaj chmury jako dynamicznego poziomu stop-loss
- Dopasuj wielkość pozycji w oparciu o grubość chmury (grubsza chmura = wyższa zmienność)
- Rozważ Kijun-sen jako trailing stop w silnych trendach
Kompatybilność ram czasowych
Tradycyjne ustawienia (9, 26, 52) opierały się na japońskim tygodniu handlowym (który miał 6 dni), więc niektórzy traderzy dostosowują te ustawienia:
- 10, 30, 60 dla wykresów dziennych
- 20, 60, 120 dla bardziej konserwatywnych sygnałów
- 7, 22, 44 dla rynków zachodnich (5-dniowy tydzień handlowy)
Podsumowanie
Ichimoku Cloud oferuje kompleksowy system handlowy, który dostarcza wiele warstw informacji rynkowych w jednym widoku. To, co czyni go potężnym, to nie tylko pojedyncze sygnały, ale zbieżność wielu wskaźników działających razem. Gdy wszystkie składniki się zgadzają, system Ichimoku może dostarczyć wysokoprawdopodobnych okazji handlowych z jasno określonymi parametrami ryzyka.
Choć początkowo wydaje się skomplikowany, z praktyką traderzy mogą rzeczywiście ocenić warunki rynkowe "na pierwszy rzut oka", jak zamierzał Hosoda. Czasowe przesunięcia składników systemu dają również unikalną perspektywę dynamiki rynku, pozwalając traderom zobaczyć potencjalne przyszłe poziomy wsparcia i oporu zanim staną się one istotne.
Podsumowanie
1. Tenkan-sen (Conversion Line): short-term momentum indicator and dynamic support/resistance.
2. Kijun-sen (Base Line): medium-term momentum indicator and stronger support/resistance, also used as a trailing stop.
3. Senkou Span A (Leading Span A): forms the leading edge of the cloud (Kumo), projected 26 periods ahead.
4. Senkou Span B (Leading Span B): forms the trailing edge of the cloud, projected 26 periods ahead.
5. Chikou Span (Lagging Span): current closing price plotted 26 periods back, confirming trends and potential reversals.
The cloud (Kumo), formed between Senkou Span A and B, represents support and resistance zones, with thickness indicating volatility and strength. The indicator provides trend determination, entry and exit signals, and support/resistance levels. It is applicable across various markets including Forex, stocks, commodities, cryptocurrencies, and indices, and works best in trending markets and multiple time frames. Risk management features include dynamic stop-loss levels based on the cloud and position sizing adjustments according to cloud thickness. Traditional settings are (9, 26, 52) periods, with common adjustments for different trading weeks.