
الوصف
نظرية صندوق دارفاس
نظرية صندوق دارفاس هي تقنية تداول طورها نيكولاس دارفاس في خمسينيات القرن العشرين. إنها استراتيجية تداول تعتمد على الزخم تستخدم حركة السعر لتحديد نقاط الدخول والخروج المحتملة في السوق.
كيف يعمل صندوق دارفاس
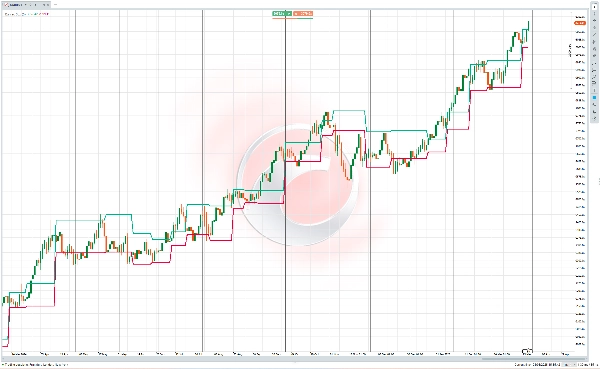
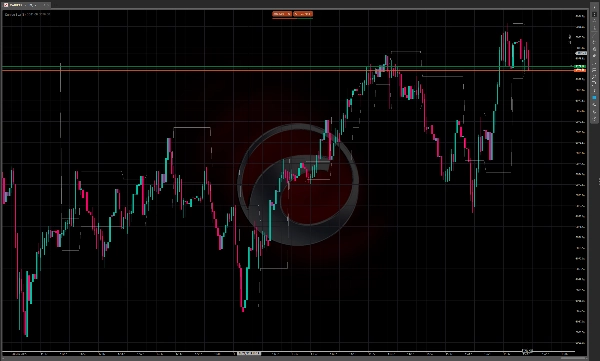
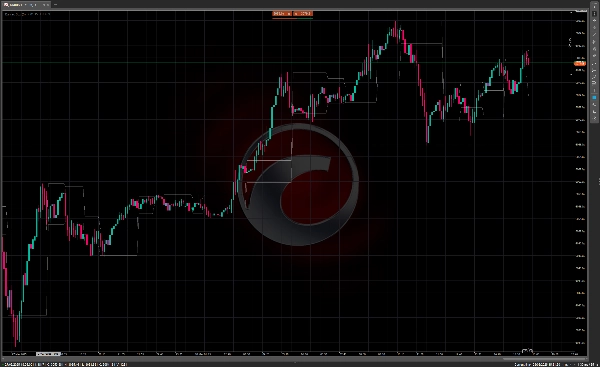
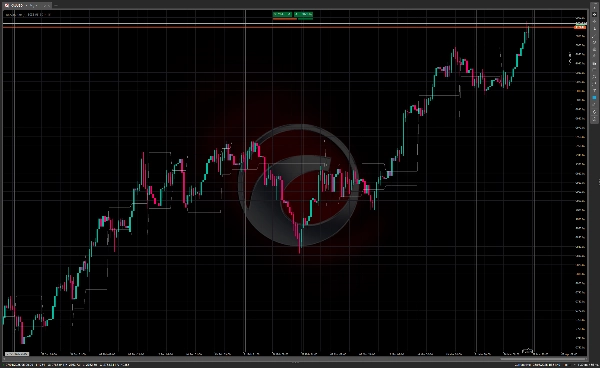
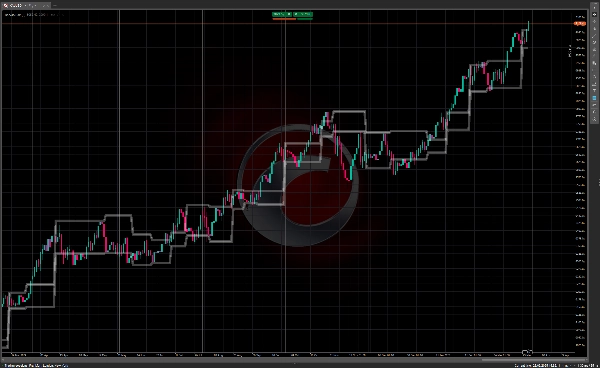
تتضمن طريقة صندوق دارفاس تحديد "صناديق" أو نطاقات تداول حيث يتماسك سعر السهم قبل أن ينفجر. تشمل المكونات الرئيسية ما يلي:
- يشكل السعر نطاق تداول محدد (الصندوق) بحدود علوية وسفلية واضحة
- تمثل الحدود العلوية المقاومة، بينما تعمل الحدود السفلية كدعم
- يشير الاختراق فوق الصندوق إلى فرصة شراء محتملة
- يمكن استخدام الانهيار تحت الصندوق كإشارة للبيع
عادةً ما يبحث المتداولون الذين يستخدمون هذه التقنية عن الأسهم التي تظهر زيادة في الحجم جنبًا إلى جنب مع حركة السعر، حيث يشير ذلك إلى زخم أقوى وراء الاختراق.
تاريخ نظرية صندوق دارفاس
كان نيكولاس دارفاس (1920-1977) شخصية غير معتادة إلى حد ما في تاريخ التداول. وُلد في المجر، ولم يكن متداولًا محترفًا بالتدريب بل كان راقصًا يؤدي في ثنائي رقص صالون يُدعى "دارفاس وجوليا" مع أخته غير الشقيقة.
أثناء جولاته العالمية مع فرقة الرقص الخاصة به في خمسينيات القرن العشرين، بدأ دارفاس في تجربة التداول في الأسهم. كانت ظروفه فريدة — فقد كان يتخذ قرارات الاستثمار استنادًا فقط إلى جداول الأسهم في الصحف التي تُسلم إليه في مدن مختلفة خلال جولته.
طور دارفاس نظريته الصندوقية من خلال التجربة والخطأ. في البداية، خسر أموالًا في الأسواق لكنه حسّن نهجه تدريجيًا. بين عامي 1956 و1958، يُقال إنه حوّل استثمارًا قدره 10,000 دولار إلى أكثر من 2 مليون دولار باستخدام طريقته الصندوقية — وهو إنجاز استثنائي جذب الانتباه.
في عام 1960، نشر دارفاس طرقه في كتاب بعنوان "كيف ربحت 2,000,000 دولار في سوق الأسهم"، الذي أصبح كلاسيكيًا في أدب التداول. شرح الكتاب رحلته وشرح نظريته الصندوقية، مما جلب هذا النهج إلى الاهتمام العام.
ما جعل طريقة دارفاس ملحوظة بشكل خاص هو بساطتها وأنها طُورت بواسطة شخص من خارج الصناعة المالية. ركز بشكل أساسي على حركة السعر والحجم بدلاً من التحليل الأساسي، وهو نهج كان جديدًا إلى حد ما في ذلك الوقت لكنه أثر منذ ذلك الحين على العديد من أنظمة التداول الفنية.
لا تزال تقنية صندوق دارفاس شائعة بين المتداولين الفنيين اليوم، لا سيما أولئك الذين يتبعون استراتيجيات تعتمد على الزخم في الأسواق ذات الاتجاهات.


![شعار "[Stellar Strategies] Moving Averages Combined 1.0"](https://cdn.ctrader.com/image/webp/93692c9d-ac16-4dd8-ba83-5a62250c39a9_27250)
![شعار "Smart Money Concepts (SMC) [Iridio Capital]"](https://cdn.ctrader.com/image/webp/28b69fd1-ef54-4bed-9487-07e78e883be4_40934)


