
Machine Learning Momentum Index
Wskaźnik
1K pobrania
Wersja 1.0, Oct 2024
Windows, Mac
4.5
Opinie: 2
Opis
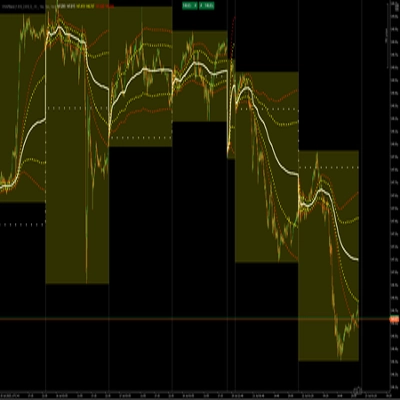
Indeks Machine Learning Momentum (MLMI) reprezentuje kolejny krok w handlu za pomocą oscylatorów. Łącząc tradycyjną analizę momentum z uczeniem maszynowym, MLMI dostarcza potężne i dynamiczne narzędzie, które odpowiada złożonościom współczesnych rynków finansowych. Oferując traderom adaptacyjny sposób rozumienia i reagowania na momentum rynku oraz trendy, ten oscylator zapewnia w czasie rzeczywistym wgląd w momentum rynku i dominujące trendy
Podsumowanie
Podsumowanie AI
The Machine Learning Momentum Index (MLMI) is an advanced oscillator that integrates traditional momentum analysis with machine learning techniques. Designed to provide real-time insights, MLMI helps traders assess market momentum and identify prevailing trends dynamically. By adapting to the complexities of modern financial markets, this indicator offers an enhanced approach to momentum trading. It is applicable across various indices, including Nasdaq, S&P 500, DAX, and Dow, supporting traders in making informed decisions based on evolving market conditions.
Profil wskaźnika
Opinie klientów
4.5
Opinie: 2
5 | 50 % | |
4 | 50 % | |
3 | 0 % | |
2 | 0 % | |
1 | 0 % |
Opinie klientów
July 9, 2025
Pros: Combines RSI-based WMAs and k‑NN machine learning for adaptive momentum detection. Highlights trend changes and consolidation zones. Cons: No alerts or tooltips. Less effective on higher timeframes. Requires other confirmation tools to trade reliably.
Dyskusja
Częste pytania
Indices
AI
Produkty dostępne za pośrednictwem cTrader Store, w tym boty handlowe, wskaźniki i wtyczki, dostarczane są przez deweloperów zewnętrznych i udostępniane wyłącznie w celach informacyjnych oraz w celu zapewnienia dostępu technicznego. cTrader Store nie jest brokerem i nie zapewnia doradztwa inwestycyjnego, nie udziela spersonalizowanych rekomendacji ani nie gwarantuje przyszłych wyników.
Więcej od tego autora


![Logo „High-Low Divergence [Iridio Capital]”](https://cdn.ctrader.com/image/webp/443c4661-7abb-40f1-842f-4b6ec560649b_40914)

Cena
2
Sprzedaż
6.9K
Bezpłatne instalacje