
설명
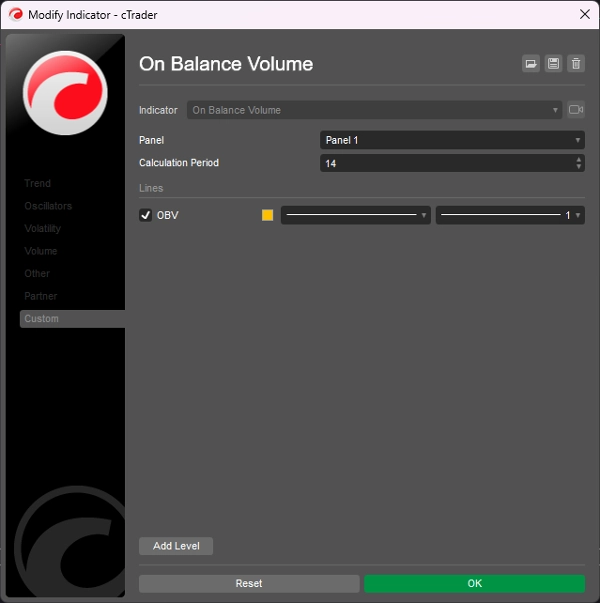
온 밸런스 볼륨(OBV)은 상승일에는 거래량을 더하고 하락일에는 거래량을 빼는 누적 지표로 매수 및 매도 압력을 측정합니다.
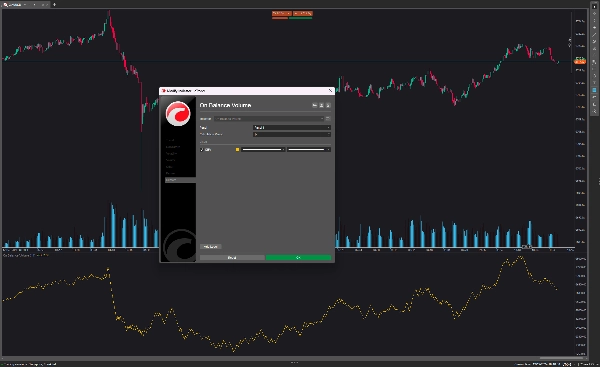
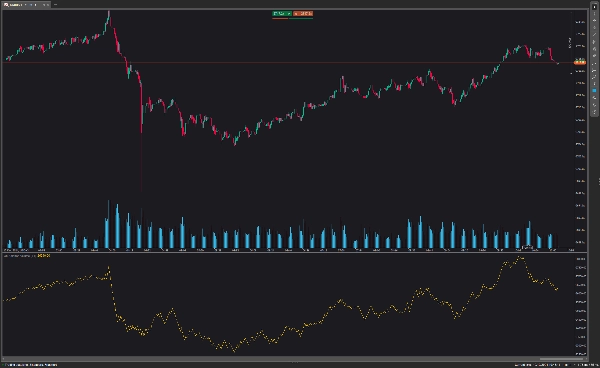
온 밸런스 볼륨은 차트 하단에 표시됩니다. OBV 선은 오늘의 종가가 상승하면 올라가고 어제의 종가가 현재 종가보다 높으면 내려갑니다.
OBV 지표는 일반적으로 가격선보다 먼저 돌파를 식별하며 명확한 상승 추세를 확립하는 데 도움을 줍니다. 이 전략으로 거래하려면 돌파 가격 수준에서 외환 포지션을 열고 최근 고점 스윙 위에 손절매를 설정하세요.
요약
AI 요약
On Balance Volume (OBV) is a technical indicator that measures buying and selling pressure by cumulatively adding volume on days when the closing price rises and subtracting volume on days when it falls. Displayed at the bottom of the chart, the OBV line moves upward when today's closing price exceeds the previous day's and moves downward when it is lower. This indicator is used to identify potential breakouts ahead of price movements and to confirm upward trends. Traders using OBV may open positions at breakout price levels and set stop losses above recent high swings. The indicator is applicable in forex markets and supports breakout trading strategies.
지표 프로필
고객 리뷰
5.0
리뷰: 1
5 | 100 % | |
4 | 0 % | |
3 | 0 % | |
2 | 0 % | |
1 | 0 % |
고객 리뷰
August 18, 2025
Pros: A lightweight cumulative volume indicator that confirms price moves and detects divergences. Excellent for analyzing trend strength and sentiment. Cons: No alerts, tooltips, or template features. Signals may lag in volatile or manipulated markets.
상담
자주 묻는 질문(FAQ)
Forex
Breakout
트레이딩 봇, 지표, 플러그인 등 cTrader Store에서 제공되는 상품은 제3자 개발자에 의해 제공되며, 이는 단순히 정보 및 기술적 접근을 목적으로 제공된 것입니다. cTrader Store는 중개인이 아니며, 투자 조언, 개인별 추천 또는 향후 성과에 대한 어떠한 보장도 제공하지 않습니다.


!["[CB] Pivot Points Pro" 로고](https://cdn.ctrader.com/image/webp/43463c82-67b0-4f10-a4ba-901bba091d81_32594)


가격
2
판매
6.89K
무료 설치