Descrizione
Blocca il calcolo della media mobile a un qualsiasi momento di mercato e monitora il comportamento del prezzo mentre si estende in avanti.
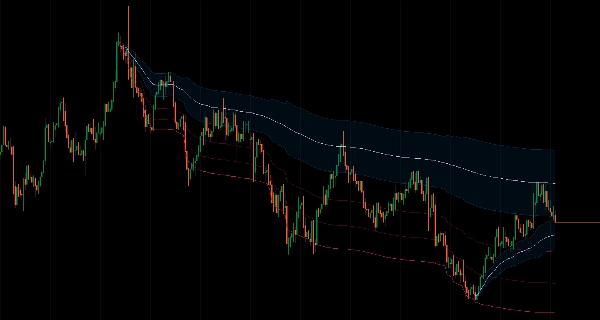
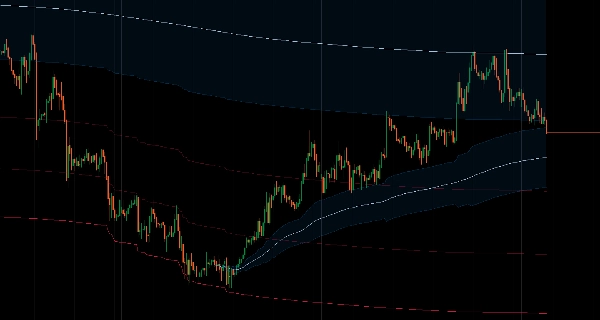
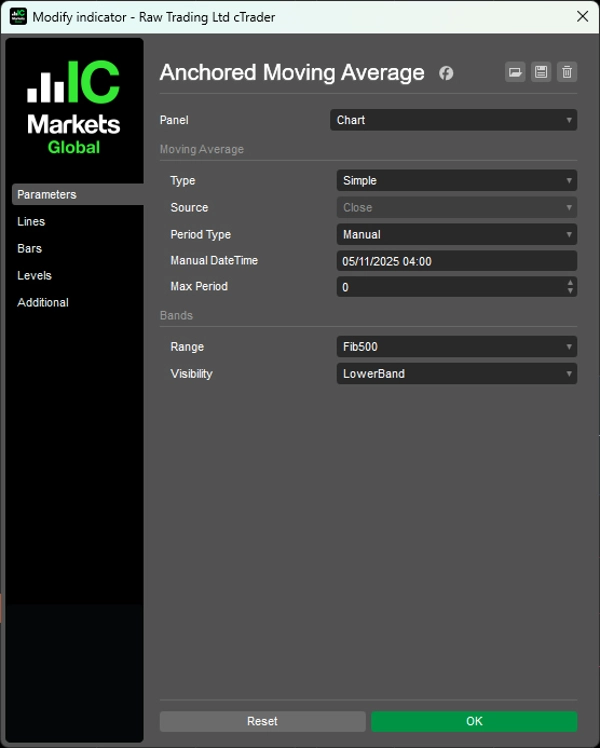
Fissa il calcolo al punto di partenza scelto (data e ora manuale o periodo di lookback da 1 ora a 10 anni), quindi cresce naturalmente con bande di Fibonacci adattive basate sull'effettiva gamma di prezzo.
Otto livelli di Fibonacci (dal 11,4% al 100%) che si adattano al movimento reale del prezzo, zona di inversione media integrata dal 38,2% al 62,8%, due tipi di MA (SMA/EMA), molteplici modalità di visualizzazione (bande complete, solo confini estremi, solo zona di inversione) e limite massimo di periodo per timeframe lunghi offrono un monitoraggio del momentum basato su eventi per trader che puntano a ritracciamenti da punti di swing significativi e analisi del comportamento del prezzo post-evento.
CARATTERISTICHE
Calcolo Ancorato al Tempo
- A differenza delle MA standard che usano periodi fissi, questa cresce naturalmente dal punto di partenza scelto
- Ancoraggio flessibile: imposta data e ora manuali o usa periodi di lookback predefiniti (da 1 ora a 10 anni)
- Monitora il momentum dai momenti significativi di mercato
- Punti di ancoraggio coerenti su diversi timeframe
Bande di Fibonacci Adattive
- Bande calcolate automaticamente basate sull'effettiva gamma di prezzo, non su multipli arbitrari di ATR
- 8 livelli di Fibonacci (dal 11,4% al 100%) che si adattano al movimento reale del prezzo
- Zone di inversione media: zona di inversione integrata dal 38,2% al 62,8% per aree di ingresso ad alta probabilità
- Zone di probabilità definite matematicamente
Due Tipi di MA
- Media Mobile Semplice
- Media Mobile Esponenziale
- Limite massimo di periodo: previene l'eccessiva levigatura su timeframe lunghi
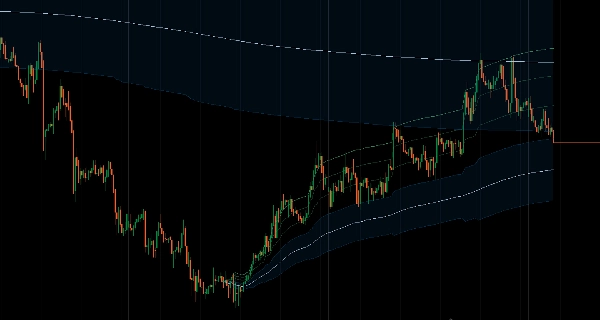
Molteplici Modalità di Visualizzazione
- Bande complete: tutti i livelli di Fibonacci visibili
- Solo superiore/inferiore: mostra solo i confini estremi
- Solo zona di inversione: focalizza sull'area di inversione media
- Design pulito e mirato senza ingombri
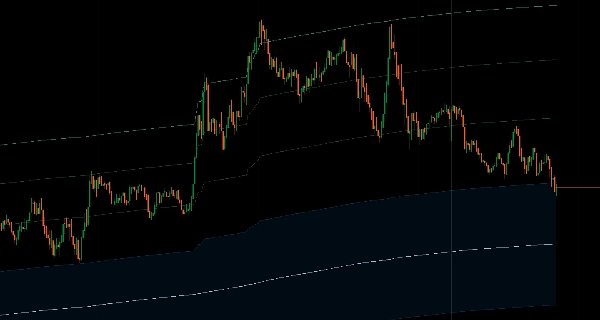
Analisi Basata su Eventi
- Vedi come il prezzo attuale si relaziona al movimento da livelli significativi
- Monitora il comportamento del prezzo post-evento
- Ingressi basati sulla struttura con punti di riferimento chiari
__________________________________________________________________________________________
ALTRI INDICATORI GRATUITI
Esplora un'ampia gamma di strumenti di analisi di mercato—dalla struttura e volume alla regressione, volatilità e timeframe personalizzati.
Il codice sorgente è disponibile nel repository GitHub.
Tutti gratuiti da usare. Ma se vuoi offrire un supporto per un caffè, puoi farlo qui.
Supporto/Resistenza
Volume
- Volume Activity Profiler
- Volume Efficiency Analyzer
- Volume Profile Analytics
- Volume Profile - Aggiornato
- Volume Spread Analysis
- VWAP (Prezzo Medio Ponderato per Volume)
Medie Mobili
- SSL Channel
- Media Mobile Ancorata
- Media Mobile Scalata per Deviazione
- Gann High Low Activator
- Linea di Tendenza Istantanea
- Kaufman Adaptive MA con Trend Vision
- Canale Media Mobile
- Suite Medie Mobili
- Media Mobile Canale di Tendenza
Utilità/Personalizzati
Basato su Regressione
Volatilità
Oscillatori
__________________________________________________________________________________________
DICHIARAZIONE DI NON RESPONSABILITÀ
Il trading comporta rischi. Questo indicatore è destinato solo all'analisi tecnica — applica sempre una corretta gestione del rischio e fai trading responsabilmente.
FEEDBACK E MIGLIORAMENTI
Se hai suggerimenti, richieste di funzionalità o idee per miglioramenti, lascia un commento nella scheda Discussione. Il tuo feedback aiuta a migliorare l'indicatore per tutti.
Riepilogo
The indicator features adaptive Fibonacci bands calculated based on the actual price range, not arbitrary multiples. It includes eight Fibonacci levels from 11.4% to 100%, with a built-in mean reversion zone between 38.2% and 62.8%, providing mathematically defined probability zones for potential entry areas. Multiple display modes are available, including full bands, extreme boundaries only, or reversion zone only, designed for a clean and purposeful chart presentation.
This tool facilitates analysis of price behavior relative to significant swing points or events, supporting structured entries and post-event price tracking. It is intended for technical analysis and includes a disclaimer advising responsible trading with proper risk management.
Recensioni dei clienti
5 | 100 % | |
4 | 0 % | |
3 | 0 % | |
2 | 0 % | |
1 | 0 % |


![Logo di "Smart Money Concepts (SMC) [Iridio Capital]"](https://cdn.ctrader.com/image/webp/28b69fd1-ef54-4bed-9487-07e78e883be4_40934)