
Woodie_CCI
Indikator
73 muat turun
Versi 1.0, Dec 2025
Windows, Mac
5.0
Ulasan: 1
Penerangan
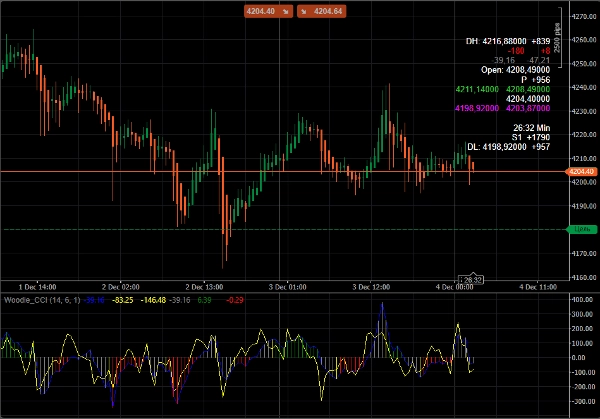
Penunjuk Woodie CCI (Woodie Commodity Channel Index) adalah variasi penunjuk CCI klasik yang dicipta untuk dagangan intrahari dan penjejakan tren. Ia dipopularkan oleh pedagang Ken Wood (Woodie), dan ia menjadi asas kepada keseluruhan sistem dagangan Woodie's CCI System.
Ringkasan
Profil indikator
Ulasan pelanggan
5.0
Ulasan: 1
5 | 100 % | |
4 | 0 % | |
3 | 0 % | |
2 | 0 % | |
1 | 0 % |
Ulasan pelanggan
December 10, 2025
Woodie_CCI offers a clean, modern take on the classic CCI. Two-line structure, trend highlighting, and smooth momentum shifts make it a strong tool for intraday traders. Stable, lightweight and easy to read. Pattern detection and alerts would make it even stronger.
Perbincangan
Soalan Lazim
Forex
Scalping
Indices
EURUSD
GBPUSD
Crypto
XAUUSD
Produk yang tersedia melalui cTrader Store, termasuk bot dagangan, indikator dan plugin, disediakan oleh pembangun pihak ketiga dan diberikan akses untuk tujuan maklumat dan teknikal sahaja. cTrader Store bukan broker dan tidak memberikan nasihat pelaburan, syor peribadi atau sebarang jaminan prestasi masa hadapan.
Lebih banyak produk daripada penulis ini


Harga
Sejak 24/10/2025
1.43M
Volum yang didagangkan
4.79K
Pip dimenangi
2
Jualan
316
Pemasangan percuma