
설명
이전 일자 예상 레벨
어제의 가격 움직임을 기반으로 한 동적 피보나치 예상으로 정밀한 거래를 실현하세요.
이 지표는 자동으로 이전 일자의 고가와 저가를 계산하고, 범위를 결정한 후, 그 범위 위와 아래에 피보나치 레벨을 투영합니다 — 잠재적 지지, 저항 및 돌파 구간에 대한 즉각적인 참조점을 제공합니다.
주요 특징
- 📅 자동 이전 일자 고가 및 저가 감지
- 📏 범위 기반 피보나치 예상: 38.2%, 50%, 61.8%, 100% 레벨
- 🔼 이전 고가 위: 강세 지속 목표를 위한 네 개의 피보나치 레벨
- 🔽 이전 저가 아래: 약세 지속 목표를 위한 네 개의 피보나치 레벨
- 🎯 세그먼트 전용 선: 오늘 첫 바부터 시작 — 차트가 복잡하지 않음
- 🏷 가격 라벨: 빠른 참고를 위한 오른쪽 가장자리 표시
- 🎨 차트 스타일에 맞게 사용자 지정 가능한 색상과 선 두께
트레이더들이 사랑하는 이유
- 명확한 일중 로드맵: 세션 시작 전에 주요 레벨을 정확히 파악할 수 있습니다.
- 양방향 분석: 상승 및 하락 움직임 모두를 계획할 수 있습니다.
- 시간 절약 자동화: 수동 그리기나 재계산이 필요 없습니다.
- 모든 타임프레임에서 작동: 스캘핑부터 스윙 트레이딩까지.
적합 대상
- 정확한 돌파 목표를 찾는 일중 트레이더
- 주요 되돌림 구간을 식별하는 스윙 트레이더
- 자신의 전략에 피보나치 레벨을 사용하는 모든 사람
💡 팁: 이 지표를 좋아하는 모멘텀 또는 거래량 도구와 결합하여 예상 레벨 주변의 진입 및 이탈을 확인하세요.
요약
AI 요약
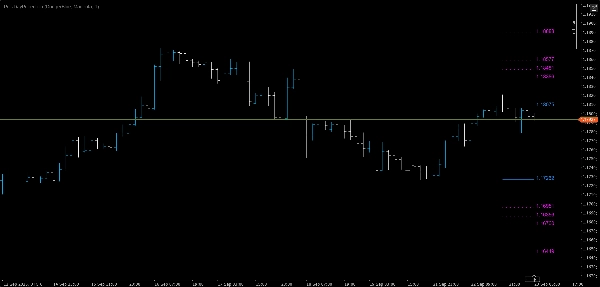
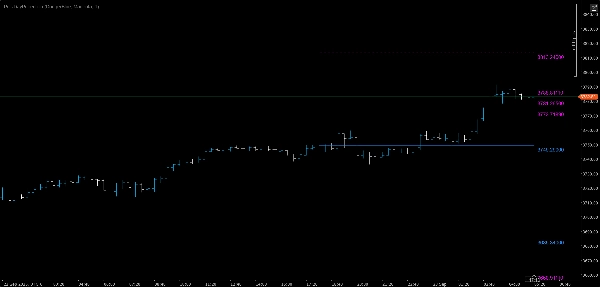
PrevDayProjection is a technical indicator designed for trading platforms that automatically calculates the previous trading day’s high and low prices, determines the range, and projects Fibonacci levels based on that range. It generates key Fibonacci retracement and extension levels at 38.2%, 50%, 61.8%, and 100% both above the previous high and below the previous low. These levels serve as potential support, resistance, and breakout zones.
The indicator displays segment-only lines starting from the current day’s first bar to avoid chart clutter and includes price labels at the right edge for quick reference. Users can customize colors and line thickness to fit their chart style. It supports any timeframe, making it suitable for scalping, day trading, and swing trading.
PrevDayProjection is applicable across multiple markets including Forex, Indices, Commodities, and Crypto, with specific tags indicating symbols like EURUSD, XAUUSD (gold), and NAS100. It provides traders with a clear intraday roadmap and dual-direction analysis to plan for both bullish and bearish moves. The tool automates manual calculations, saving time and enhancing precision in identifying breakout targets and retracement zones.
지표 프로필
고객 리뷰
0.0
리뷰: 0
고객 리뷰
이 상품에 대한 리뷰가 아직 없습니다. 이미 사용해 보셨나요? 다른 사람들에게 가장 먼저 소개해 주세요!
상담
자주 묻는 질문(FAQ)
Forex
Indices
EURUSD
Commodities
Crypto
XAUUSD
NAS100
트레이딩 봇, 지표, 플러그인 등 cTrader Store에서 제공되는 상품은 제3자 개발자에 의해 제공되며, 이는 단순히 정보 및 기술적 접근을 목적으로 제공된 것입니다. cTrader Store는 중개인이 아니며, 투자 조언, 개인별 추천 또는 향후 성과에 대한 어떠한 보장도 제공하지 않습니다.


가격
26
판매
2.14K
무료 설치