
설명
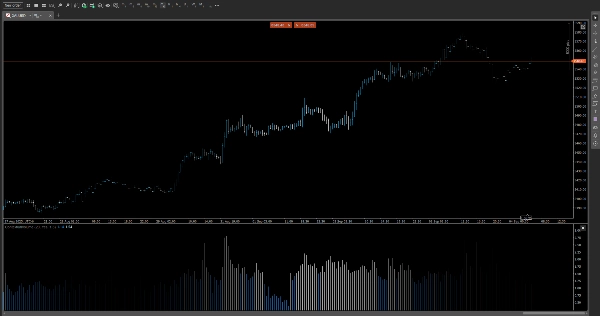
📊 상대 거래량 일중 지표 (RVI)
중요한 거래량 급증을—중요한 순간에 포착하세요.
RVI는 현재 거래량을 동일 시간대의 과거 평균과 비교하여 일중 세션 전반에 걸친 숨겨진 모멘텀과 유동성 변화를 드러내는 정밀 설계된 지표입니다.
🔍 주요 특징
• 시간대별 거래량 프로파일링
이전 세션 전반에 걸쳐 각 시간대(예: 오전 10:15)의 평균 거래량을 계산하여 각 캔들에 대한 맥락적 기준을 제공합니다.
• 다중 시간 프레임 지원
5분 차트부터 12시간 차트까지 원활하게 작동하며, 스캘핑, 스윙, 세션 기반 등 거래 스타일에 맞게 적응합니다.
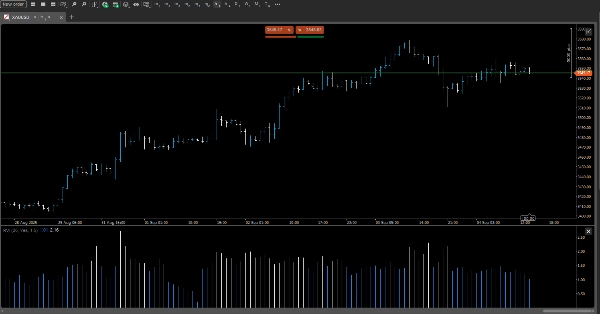
• 동적 색상 코딩
사용자 정의 가능한 색상 임계값을 사용하여 평균 이상 거래량의 캔들을 강조 표시합니다. 직관적인 시각적 신호로 높은 활동 영역을 즉시 파악할 수 있습니다.
• 비율 모드 vs. 차이 모드
선호하는 측정 방식을 선택하세요:
• 비율 모드: 현재 거래량 ÷ 평균 거래량 표시 (예: 2.3배)
• 차이 모드: 절대 편차 표시 (예: +1,200 계약)
• 오버레이 또는 패널 표시
기존 레이아웃과 깔끔하게 통합할 수 있도록 인라인 차트 오버레이 또는 컴팩트한 사이드 패널 간 전환이 가능합니다.
🎯 사용 사례
• 일반적인 활동 대비 거래량 급증으로 돌파력 확인
• 저거래량 기간 동안의 거짓 신호 필터링
• 주요 일중 시간대에 기관 투자자 흔적 식별
• 시간 인지 맥락으로 거래량 기반 전략 강화
⚙️ 사용자 정의 옵션
• 과거 평균 계산을 위한 조정 가능한 조회 기간
• 거래량 강도에 대한 사용자 정의 색상 임계값
• 표시 모드 전환 (비율/차이)
• 다크/라이트 테마 호환
요약
고객 리뷰
5 | 100 % | |
4 | 0 % | |
3 | 0 % | |
2 | 0 % | |
1 | 0 % |


