
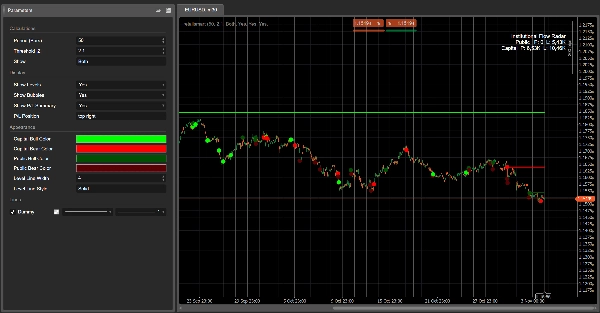
Institutional Flow Radar
지표
3 구매
버전 1.0, Nov 2025
Windows, Mac
4.3
리뷰: 3
설명
기관 흐름 레이더 – 설명
개념:
기관 흐름 레이더는 차트에서 비정상 거래량 이벤트를 스캔하고 두 그룹으로 분류합니다:
- 자본 → 더 강력하고 정보가 많은 참가자에게 귀속된 활동
- 대중 → 더 넓은 군중에게 귀속된 활동
그 후:
- 해당 이벤트에 수평선을 그립니다,
- 가장 관련성 높은 이벤트를 색깔 있는 버블로 표시합니다,
- 그리고 손익 요약을 보여주어 자본과 대중의 거래량이 현재 얼마나 이익 또는 손실 상태인지 비교합니다.
한눈에 큰 거래량이 어디에 있었는지, 누가 이기고 있는지, 그리고 어떤 가격대가 아직 유지되고 있는지를 볼 수 있습니다.
작동 방식 (간단 버전)
- 각 바마다 알고리즘은 지난 N 바(기간) 동안의 거래량 Z-점수를 계산합니다.
- 절대값 Z-점수가 설정한 임계값 |Z|를 초과하면 해당 바는 거래량 이벤트로 태그됩니다.
- 캔들 구조(몸통 대 전체 범위)를 사용하여 이벤트를 분류합니다:
-
- 작은 몸통, 긴 꼬리 → 자본 (흡수 / 더 복잡한 행동)
- 큰 몸통, 방향성 움직임 → 대중 (군중 스타일 돌파 / 추격)
- 이벤트 가격에 수평선이 그려지며, 가격이 해당 수준을 명확히 돌파할 때까지 유지됩니다 (완화).
- 각 활성 레벨에 대해 레이더는 현재 가격이 다음 상태인지 확인합니다:
-
- 이익 상태 (가격이 이벤트 방향으로 움직임), 또는
- 손실 상태 (가격이 반대 방향으로 움직임).
- 모든 활성 레벨의 거래량을 집계하는 손익 요약 상자가 있습니다:
-
- 자본 이익 대 자본 손실
- 대중 이익 대 대중 손실
시각적 요소
- 자본 레벨:
-
- 상승 이벤트 → 강세 자본 레벨 (예: 밝은 녹색 / 아쿠아)
- 하락 이벤트 → 약세 자본 레벨 (예: 밝은 빨강)
- 대중 레벨:
-
- 상승 이벤트 → 강세 대중 레벨 (회색 톤)
- 하락 이벤트 → 약세 대중 레벨 (더 어두운 회색 / 숯색)
- 버블:
-
- 가장 중요한 이벤트에 원형 표시, 다음 기준으로 색칠됨:
-
- 방향 (강세/약세)
- 분류 (자본 / 대중)
- 손익 요약 상자:
-
- 행: 대중, 자본
- 열: 이익, 손실
- 셀 배경 강도는 해당 거래량에 따라 증가합니다.
제안된 매개변수 레이블 (영어)
- 기간 (바): 거래량 Z-점수를 계산하는 데 사용되는 바 수.
- 임계값 |Z|: 이벤트를 표시하기 위한 최소 절대 Z-점수.
- 표시:
Capital,Public, 또는Both– 표시할 클래스. - 레벨 표시 / 버블 표시 / 손익 요약 표시
- 자본 강세 색상 / 자본 약세 색상
- 대중 강세 색상 / 대중 약세 색상
- 평균 선 너비 / 평균 선 스타일
요약
AI 요약
Institutional Flow Radar is a trading indicator that identifies and classifies abnormal volume events on price charts into two categories: Capital (activity from stronger or more informed participants) and Public (activity from the broader crowd). It calculates a volume Z-score for each bar over a specified period and flags bars exceeding a set threshold as volume events. These events are further classified based on candle structure—smaller bodies with long wicks indicate Capital activity, while larger bodies with directional moves indicate Public activity.
The indicator visually marks these events by drawing horizontal levels at event prices, which remain until price moves decisively through them. Significant events are highlighted with colored bubbles indicating direction (bullish or bearish) and classification (Capital or Public). A P/L summary box aggregates volume at active levels, showing Capital and Public volumes currently in profit or loss.
Users can customize parameters such as the period for Z-score calculation, threshold for event detection, and visual settings including colors for bullish and bearish levels for both Capital and Public groups. This tool provides a consolidated view of where large volume occurred, which participant group is prevailing, and which price levels are holding, aiding in volume-based breakout analysis.
지표 프로필
고객 리뷰
4.3
리뷰: 3
5 | 33 % | |
4 | 67 % | |
3 | 0 % | |
2 | 0 % | |
1 | 0 % |
고객 리뷰
November 18, 2025
The only reason it stays interesting is the trading notes stop feeling so random, and two sessions say more than one clean chart.
November 9, 2025
상담
자주 묻는 질문(FAQ)
Breakout
트레이딩 봇, 지표, 플러그인 등 cTrader Store에서 제공되는 상품은 제3자 개발자에 의해 제공되며, 이는 단순히 정보 및 기술적 접근을 목적으로 제공된 것입니다. cTrader Store는 중개인이 아니며, 투자 조언, 개인별 추천 또는 향후 성과에 대한 어떠한 보장도 제공하지 않습니다.


!["[Hamster-Coder] Moving Average MTF" 로고](https://cdn.ctrader.com/image/webp/b11b98b1-194d-4b8e-b00e-d611826ad159_31226)


가격
42.11M
거래량
6.13M
핍 수익
222
판매
8.39K
무료 설치