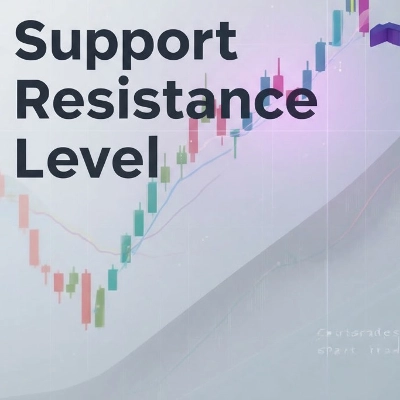
Support Resistance
インジケーター
バージョン 1.0、Nov 2025
Windows、Mac
5.0
レビュー: 2
説明
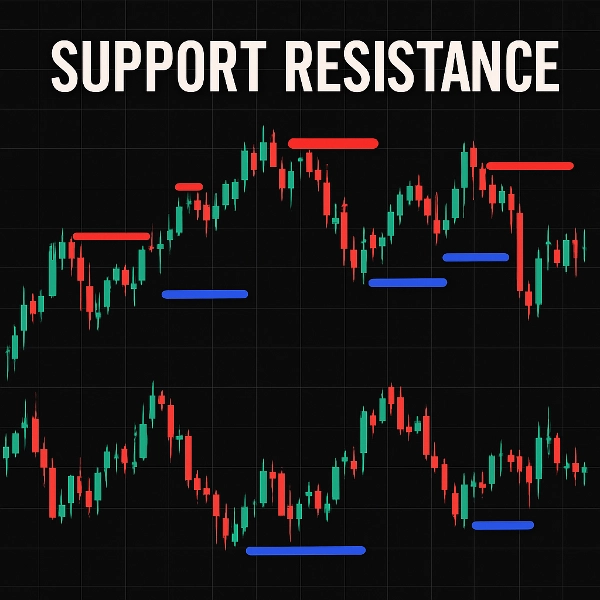
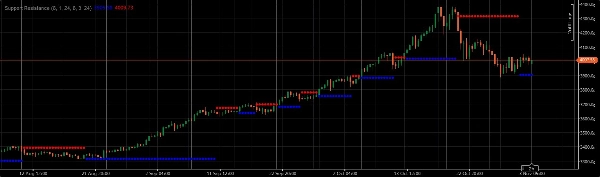
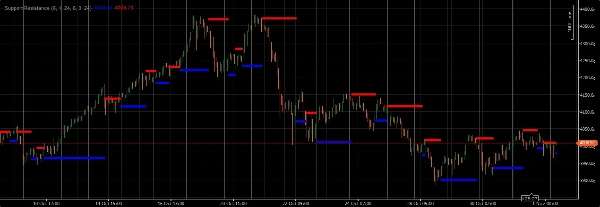
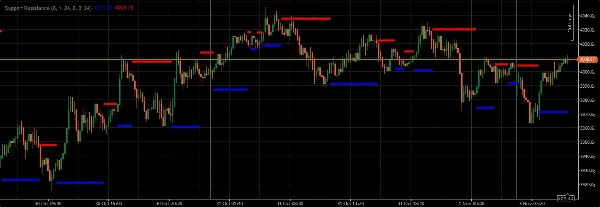
金取引を行う際は、さまざまな時間枠(大きなチャート、レンジチャート、ティックチャート)にわたるサポートおよびレジスタンスレベルを使用して、潜在的なピボットのブレイクアウトやサポート/レジスタンスポイントを特定します。これらのシグナルは、移動平均線、オシレーター、ローソク足パターンなどの他のテクニカル指標で常に確認し、より高い確率の取引を目指してください。
金取引を行う際は、さまざまな時間枠(大きなチャート、レンジチャート、ティックチャート)にわたるサポートおよびレジスタンスレベルを使用して、潜在的なピボットのブレイクアウトやサポート/レジスタンスポイントを特定します。これらのレベルは一度特定されると、重要な意思決定ポイントとして機能します。レジスタンスを上抜けるかサポートを下抜けるブレイクアウトは、特にローソク足の実体が大きくなった場合、トレンドの継続や市場心理の大きな変化を示すことが多いです。逆に、サポートレベルでの反発やレジスタンスでの拒否は、潜在的な反転や現在の保ち合いの継続を示すことがあります。これらのシグナルは、移動平均線、オシレーター、ローソク足パターンなどの他のテクニカル指標で常に確認し、より高い確率の取引を目指してください。さらに、ニュースイベントや経済指標の発表にも注意を払いましょう。これらは金価格に大きな影響を与え、純粋なテクニカルセットアップを無効にすることがあります。リスク管理は非常に重要であり、単一の取引で取引資本のごく一部以上をリスクにさらさないようにしてください。
概要
インジケーターのプロフィール
カスタマーレビュー
5.0
レビュー: 2
5 | 100 % | |
4 | 0 % | |
3 | 0 % | |
2 | 0 % | |
1 | 0 % |
ディスカッション
よくあるご質問
Forex
Breakout
Scalping
EURUSD
Commodities
GBPUSD
NZDUSD
XAUUSD
ATR
USDJPY
cTrader Storeで入手可能な取引ボット、インジケーター、プラグインなどの商品は、第三者の開発者が提供するものであり、情報と技術の取得のみを目的としてご利用いただけます。cTrader Storeはブローカーではなく、投資助言や個人的な推奨を行うことも、将来のパフォーマンスを保証することもありません。
これも好きかも

![「Smart Money Concepts (SMC) [Iridio Capital]」ロゴ](https://cdn.ctrader.com/image/webp/28b69fd1-ef54-4bed-9487-07e78e883be4_40934)


![「Gaussian Channel [Iridio Capital]」ロゴ](https://cdn.ctrader.com/image/webp/7c039209-5573-4a54-a072-f9528b503103_41960)


価格
登録日 02/08/2025
39.95M
取引数量
115.5K
獲得pips