

Smart Money Map - JR
Gösterge
1 satın almalar
Sürüm 2.0, May 2026
Windows, Mac
4.0
Değerlendirmeler: 2

Başlangıç 11/02/2026
18
Satışlar
340
Ücretsiz yüklemeler
Açıklama
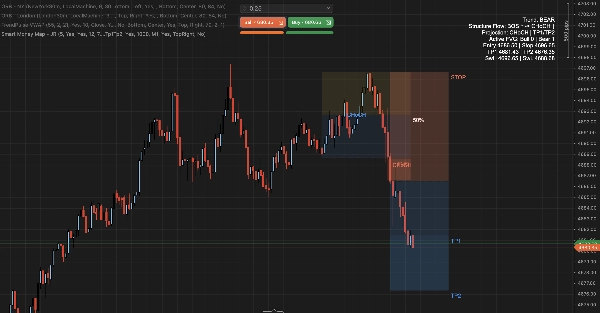
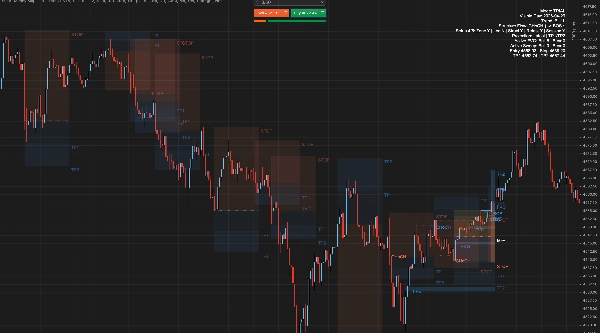
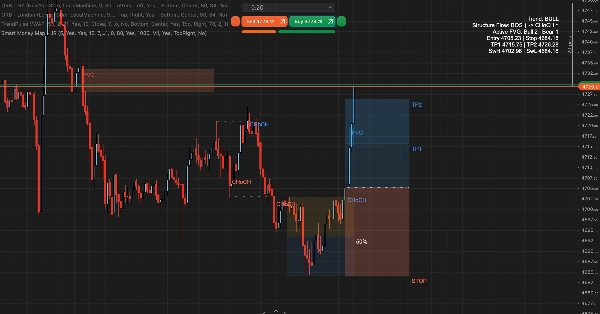
Ana yürütme bağlamını vurgulamak ve yapıyı, konumu ve riski tek bir düzenli iş akışında hizalamaya yardımcı olmak için gelişmiş örtüşme göstergesi.
➤ Temel Özellikler
- Yapı olayı etiketleme, yapılandırılabilir hassasiyet ve onay modu ile
- Yapılandırılabilir boyutlandırma ve oturum filtreleme ile aktif adil değer boşluğu haritalaması
- Erken bağlam için likidite süpürme tespiti (sadece skor, minimal mod)
- %50 denge ile prim/iskonto işlem aralığı
- Dinamik giriş/durdurma/hedef projeksiyon kutusu
- Esnek hedef görselleştirme: tek hedef, bölünmüş TP1/TP2 veya yapıdan türetilmiş hedefler
- Daha sıkı günlük içi kontrol için isteğe bağlı projeksiyon etiket görünürlüğü ve maksimum durdurma sınırı
- cBot iş akışları için otomasyona hazır çıktı kanalları
- Çoklu gösterge grafiklerinde esnek pano yerleşimi
- İsteğe bağlı zaman dilimi otomatik ayarı ile yoğunluk ön ayarları
➤ Nasıl Çalışır
- Yapısal salınımları doğrular ve yön değişimi ile devam durumlarını izler.
- Korunan salınım seviyelerinin ötesindeki likidite süpürmelerini tespit eder.
- Aktif dengesizlik bölgelerini haritalar ve fiyat yapı ile etkileşime girdikçe günceller.
- Mevcut piyasa konumunu prim/iskonto bağlamı ile çerçeveler.
- Mevcut yapı durumundan bir risk haritası projekte eder.
- Otomasyon için deterministik olay çıktıları yayınlar.
➤ En Uygun
- Gün içi SMC grafik çizimi ve yürütme planlaması
- Ağır karmaşa olmadan görsel yapı ve POI bağlamı isteyen tüccarlar
- Yapılandırılabilir pano yerleşimi gereken çoklu gösterge kurulumları
➤ Nasıl Kullanılır
- Öncelikle panodaki trend göstergesini kullanarak yapıyı okuyun.
- Konum bağlamını kullanarak prim ve iskonto bölgelerini belirleyin.
- Zamanlamayı iyileştirmek için aktif dengesizlik bölgeleri ve isteğe bağlı süpürme bağlamını kullanın.
- Ticaret planlama referansı için projeksiyon haritasını kullanın.
➤ Dahil Kontroller
- Yapı hassasiyeti ve onay modu
- Dengesizlik boyutlandırma, oturum filtreleme ve hafifletme görüntüleme davranışı
- İşlem aralığı ve projeksiyon görüntüleme seçenekleri
- Hedef modu, çapa modu, etiket görünürlüğü ve isteğe bağlı durdurma sınırı dahil projeksiyon kontrolleri
- Yoğunluk modları: Özel, M1, M5, M15, H1, H4, D1
- Grafik zaman dilimine göre isteğe bağlı otomatik yoğunluk ayarı
- Grafik okunabilirliği için renk özelleştirmesi
Özet
YZ özeti
Smart Money Map - JR is an advanced overlay indicator designed for intraday trading to visually highlight key market execution contexts by integrating structure, location, and risk into a streamlined workflow. It identifies and labels structural events with configurable sensitivity and confirmation modes, detects liquidity sweeps beyond swing levels, and maps active fair value gaps with adjustable sizing and session filters. The indicator frames market price zones into premium and discount ranges centered around a 50% equilibrium level.
It features dynamic projection boxes for entry, stop, and target levels, supporting flexible target visualization options including single targets, split take-profits, or structure-derived targets. Users can control projection label visibility and apply maximum stop caps for tighter intraday risk management. The tool supports automation through deterministic event outputs compatible with cBot workflows and allows customizable dashboard placement for multi-indicator chart setups. Density presets with optional automatic timeframe adjustment enhance adaptability across different chart resolutions.
The indicator operates by confirming structural swings, tracking directional shifts, detecting liquidity sweeps, updating imbalance zones as price interacts with structure, and projecting a risk map based on current market conditions. It is suited for traders seeking clear visual structure and points of interest without chart clutter, particularly those focused on Smart Money Concepts (SMC) and market structure analysis.
It features dynamic projection boxes for entry, stop, and target levels, supporting flexible target visualization options including single targets, split take-profits, or structure-derived targets. Users can control projection label visibility and apply maximum stop caps for tighter intraday risk management. The tool supports automation through deterministic event outputs compatible with cBot workflows and allows customizable dashboard placement for multi-indicator chart setups. Density presets with optional automatic timeframe adjustment enhance adaptability across different chart resolutions.
The indicator operates by confirming structural swings, tracking directional shifts, detecting liquidity sweeps, updating imbalance zones as price interacts with structure, and projecting a risk map based on current market conditions. It is suited for traders seeking clear visual structure and points of interest without chart clutter, particularly those focused on Smart Money Concepts (SMC) and market structure analysis.
Gösterge profili
Gösterge kategorisi
Piyasa yapısı (SMC)
Çıktı türü
Görselleştirme
Veri gereklilikleri
Yalnızca çubuklar
Desteklenen sinyaller
Trend gücü
Seviye kırılması
Seviyeye dokunuş
Müşteri değerlendirmeleri
4.0
Değerlendirmeler: 2
5 | 0 % | |
4 | 100 % | |
3 | 0 % | |
2 | 0 % | |
1 | 0 % |
Tartışma
SSS
Premium/Discount
MSS
BOS
CHOCH
Market Structure
cTrader Store üzerinden erişilebilen işlem botları, göstergeler ve eklentiler gibi ürünler, üçüncü taraf sağlayıcılar tarafından sağlanır ve yalnızca bilgilendirme ve teknik erişim amaçlarıyla sunulur. cTrader Store bir broker değildir ve yatırım tavsiyesi, kişisel öneriler vermez veya gelecekteki performansı garanti etmez.





















Fiyat
Başlangıç 11/02/2026
18
Satışlar
340
Ücretsiz yüklemeler