
Описание
Демонстрация:
Market Cipher B — мощный и в то же время удобный индикатор технического анализа, созданный, чтобы помочь вам принимать уверенные торговые решения на финансовых рынках — от криптовалют до акций и форекса. Независимо от того, новичок вы или опытный трейдер, этот осциллятор предоставляет чёткие сигналы на покупку и продажу, давая вам преимущество для уверенного ориентирования в волатильных рынках.
Почему стоит выбрать Market Cipher B?
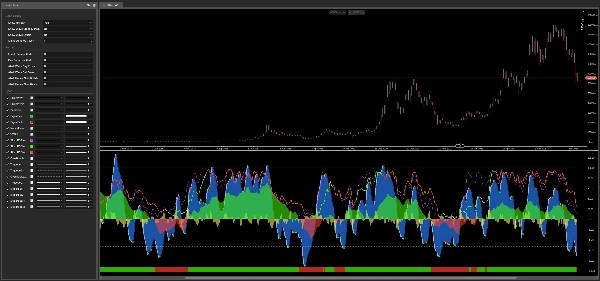
1. Чёткие сигналы на покупку и продажу Индикатор точно определяет оптимальные точки входа и выхода с помощью легко читаемых сигналов. Зелёные точки сигнализируют о возможностях для покупки, а красные — о необходимости продажи. Это упрощает быстрые и решительные действия даже без глубоких технических знаний.
2. Синие волны — рыночный импульс с первого взгляда Market Cipher B использует две динамичные синие волновые линии, которые показывают, набирает ли рынок силу или теряет её. Их пересечения выделяют ключевые моменты для ловли новых трендов или избежания потенциальных убытков. Волновая система является основным двигателем индикатора, обеспечивая надёжную основу для всех остальных сигналов.
3. Распространение волнового импульса — ваш направляющий компас Жёлтая линия представляет собой разницу между двумя синими волнами, выступая в роли индикатора импульса в реальном времени. Когда она поднимается выше нуля, покупатели контролируют рынок; когда опускается ниже — доминируют продавцы. Это помогает мгновенно определить, есть ли у тренда сила или он близок к истощению и возможному развороту.
4. Денежный поток — отслеживайте движение капитала Зелёно-красная линия Денежного потока показывает, куда инвесторы направляют свои средства. Рассчитанная как сглаженный осциллятор за 60 периодов, она выявляет моменты входа и выхода институциональных или крупных игроков с рынка. Пересечения выше и ниже нулевой линии особенно важны, часто предвосхищая значительные ценовые движения и давая вам значительное преимущество.
5. Полоса MFI — мгновенный сигнал движения капитала Цветная полоса, отображаемая в нижней части панели индикатора, обеспечивает визуализацию текущего направления Денежного потока. Зелёная полоса сигнализирует о доминировании бычьего капитала, а красная — о медвежьем давлении. Переходы цвета на полосе сразу выделяют возможные развороты тренда без необходимости численного анализа — это один из самых быстрых визуальных сигналов в индикаторе.
6. Стохастический RSI — точное определение времени Фиолетовая линия Стохастического RSI в сочетании с зелёно-красными медленными линиями RSI помогает точно определить перекупленность (возможное переоценивание) или перепроданность (возможное недооценивание) рынка. Двойная скорость — быстрая линия (40 периодов) и медленная (81 период) — позволяет отличать краткосрочный шум от реальных изменений импульса, что идеально подходит для поиска точек с высокой вероятностью разворота и избегания типичных рыночных ловушек.
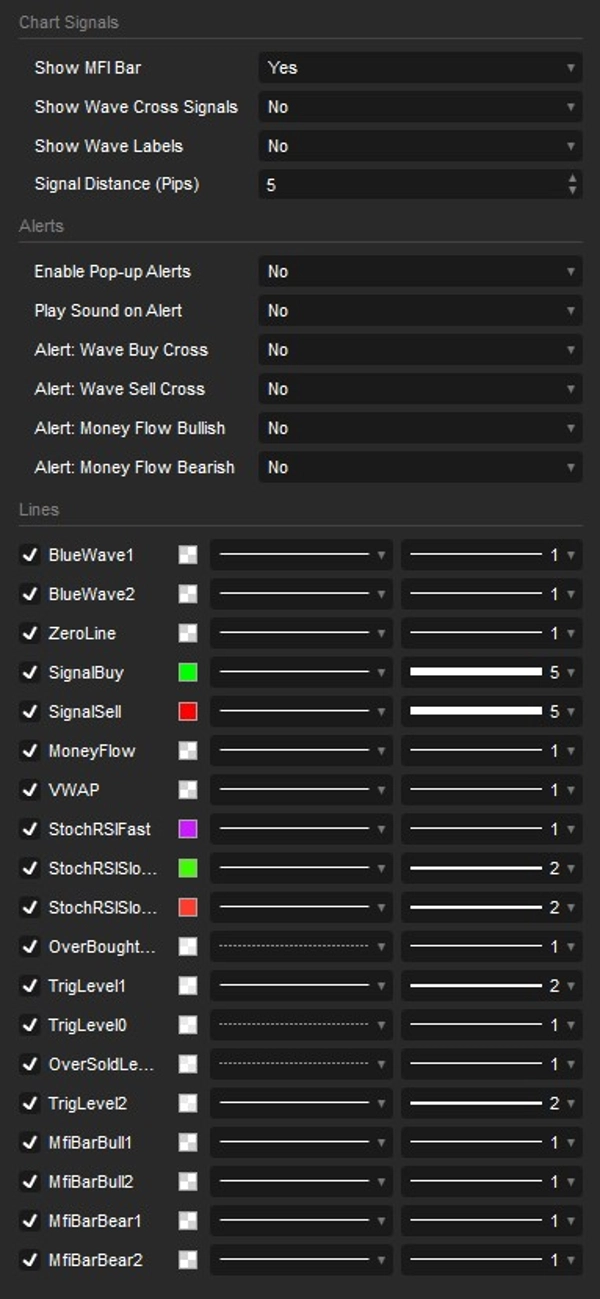
7. Умная система оповещений — не пропустите ни одного сигнала Market Cipher B включает полностью настраиваемую систему уведомлений, которая информирует вас даже когда вы не у экрана. Вы можете независимо включать или отключать всплывающие оповещения и звуковые уведомления для четырёх ключевых событий: пересечение волновой линии на покупку, пересечение волновой линии на продажу, пересечение Денежного потока выше нуля (бычий сигнал) и пересечение Денежного потока ниже нуля (медвежий сигнал). Каждый тип оповещения можно настроить отдельно, давая полный контроль над тем, что важно для вашей торговой стратегии.
8. Гибкость и настройка Market Cipher B работает безупречно на любом рынке и таймфрейме, доступном в cTrader — от минутных скальпинговых графиков до недельных обзоров свинг-трейдинга. Вы полностью контролируете, какие компоненты отображать, включая полосу MFI, сигналы пересечения волн, метки сигналов (текст Buy/Sell прямо на ценовом графике) и все типы оповещений. Такая модульность позволяет адаптировать индикатор под ваш стиль торговли без визуального нагромождения.
Для кого предназначен Market Cipher B?
Новички оценят интуитивно понятные сигналы на покупку/продажу, цветовую визуализацию и чёткие уровни, которые упрощают начало торговли без необходимости многолетнего опыта технического анализа. Индикатор передаёт свои выводы визуально, позволяя тратить меньше времени на чтение чисел и больше — на реализацию возможностей.
Опытные инвесторы найдут ценность в продвинутых компонентах — Денежном потоке, Распространении волнового импульса и двойном Стохастическом RSI — которые вместе дают многослойное представление о структуре рынка, подходящее для сложных стратегий с высокой уверенностью.
Дневные и свинг-трейдеры выгодно используют гибкость таймфреймов индикатора и быструю генерацию сигналов, что позволяет им извлекать выгоду как из быстрых внутридневных движений, так и из долгосрочных направленных трендов без необходимости переключаться между множеством инструментов.
Сводка
Additional components include a Money Flow line that tracks capital movement by large investors, accompanied by a color-coded Money Flow bar for quick visual cues on market pressure. A dual-speed Stochastic RSI helps identify overbought and oversold conditions, aiding in precise timing for potential reversals.
Market Cipher B supports full customization, allowing users to enable or disable specific features and alerts for key events such as wave crosses and Money Flow shifts. It operates on any timeframe, from minute charts to weekly views, making it suitable for new traders, experienced investors, day traders, and swing traders. The indicator integrates multiple analytical tools into one interface, aiming to provide a comprehensive market overview and assist in making informed trading decisions.
Отзывы покупателей
5 | 67 % | |
4 | 33 % | |
3 | 0 % | |
2 | 0 % | |
1 | 0 % |


![Логотип продукта "Gaussian Channel [Iridio Capital]"](https://cdn.ctrader.com/image/webp/7c039209-5573-4a54-a072-f9528b503103_41960)


