
الوصف
عرض توضيحي:
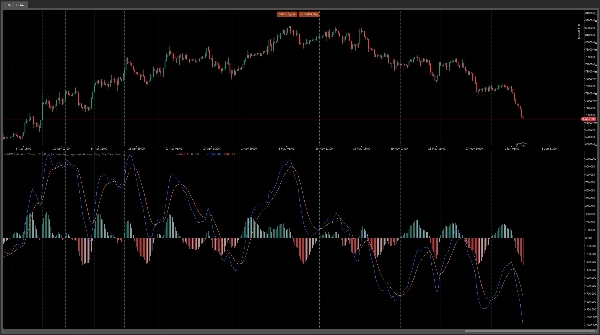
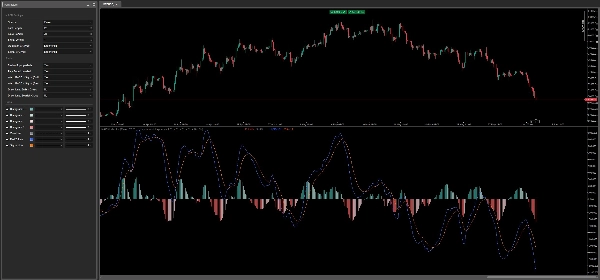
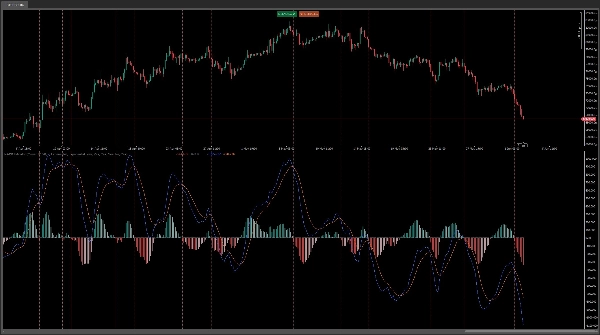
مؤشر MACD هو نسخة محسنة بصريًا ومكررة من مذبذب تقارب وتباعد المتوسط المتحرك الكلاسيكي (MACD) لمنصة cTrader. تم بناؤه ليحاكي سلوك ومظهر النسخة الأصلية من TradingView، ويوفر تجربة مألوفة واحترافية مع عدة ترقيات ذكية.
لماذا تختار مؤشر MACD؟
1. توافق 100% مع TradingView
يتبع الخوارزمية الأساسية نفس المنطق تمامًا مثل MACD القياسي على TradingView. يحسب خط MACD كفرق بين المتوسط المتحرك السريع والبطيء، ويشتق خط الإشارة من متوسط متحرك ثالث، ويرسم المدرج التكراري كفرق بين الاثنين. النتيجة هي توافق دقيق مع الرسوم البيانية التي تعرفها بالفعل.
2. مدرج تكراري ذكي بأربعة ألوان
بدلاً من المدرج التكراري ذو اللونين البسيط، يستخدم هذا المؤشر نظام تدرج لوني ديناميكي بأربعة ألوان مطابق لتطبيق PineScript في TradingView:
- إيجابي قوي – شريط المدرج التكراري فوق الصفر *ويزداد*
- إيجابي ضعيف – شريط المدرج التكراري فوق الصفر *لكنه* ينخفض
- سلبي ضعيف – شريط المدرج التكراري تحت الصفر *لكنه* يزداد
- سلبي قوي – شريط المدرج التكراري تحت الصفر *وينخفض*
تتيح لك هذه الذكاء اللوني تقييم ما إذا كانت الزخم يتسارع أو يضعف على الفور، دون الحاجة إلى تفسير الأرقام الخام.
3. نظام تنبيه مدمج مع نافذة منبثقة وصوت*
ابقَ على اطلاع حتى عندما تكون بعيدًا عن الشاشة. يمكن للمؤشر إرسال إشعارات منبثقة أصلية من cTrader وتشغيل أصوات مميزة عند:
- تقاطع خط MACD فوق خط الإشارة (تقاطع صعودي – إشارة شراء)
- تقاطع خط MACD تحت خط الإشارة (تقاطع هبوطي – إشارة بيع)
يمكن تبديل كل نوع من التنبيهات بشكل مستقل، والنظام محمي من التنبيهات المكررة على نفس الشمعة.
4. إشارات بصرية قابلة للتخصيص
يمكنك اختيار رسم خطوط رأسية منقطة على الرسم البياني في كل مرة يحدث فيها تقاطع صعودي أو هبوطي. هذا يجعل من السهل مسح الرسوم البيانية التاريخية وتحديد مناطق الإشارة السابقة بنظرة سريعة، دون الحاجة للتمرير اليدوي عبر البيانات.
5. قابلية تخصيص ومرونة كاملة
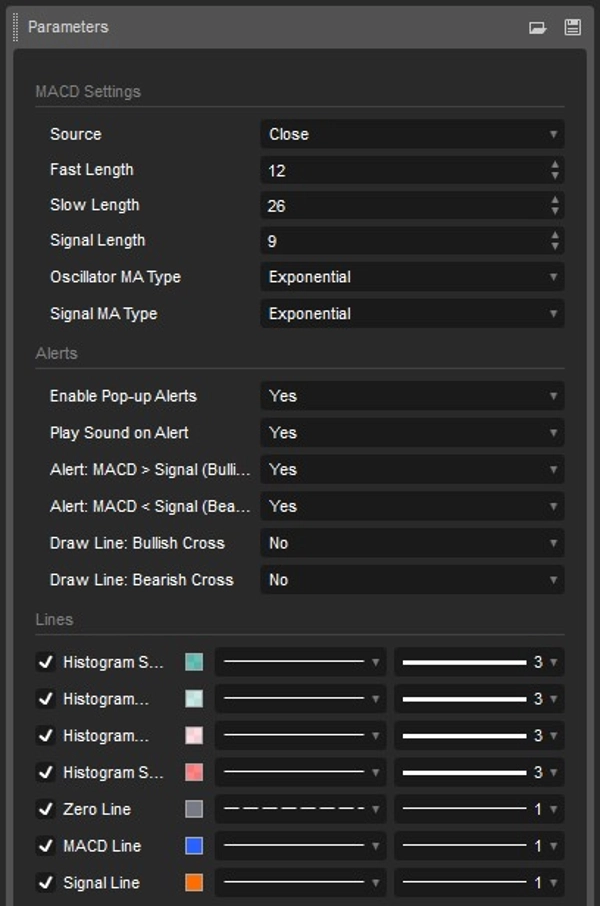
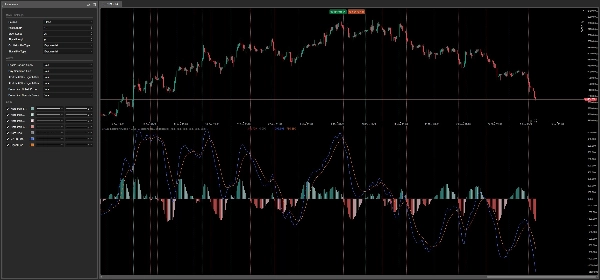
قم بضبط كل جانب من جوانب المؤشر ليتناسب مع أسلوب تداولك:
- الطول السريع – فترة المتوسط المتحرك السريع
- الطول البطيء – فترة المتوسط المتحرك البطيء
- طول الإشارة – فترة المتوسط المتحرك لخط الإشارة
- نوع المتوسط المتحرك للمذبذب – اختر من أي نوع متوسط متحرك (EMA، SMA، إلخ) لحساب MACD
- نوع المتوسط المتحرك للإشارة – اختر نوع المتوسط المتحرك لخط الإشارة بشكل مستقل
لمن هذا المؤشر؟
مستخدمو TradingView المحترفون الذين يريدون MACD أصلي لمنصة cTrader يتصرف ويحسب ويلون تمامًا مثل النسخة الأصلية – بدون مفاجآت أو اختلافات.
المتداولون التقديريون الذين يبحثون عن تنبيهات تقاطع واضحة وفي الوقت الحقيقي مع إشعارات منبثقة وصوت، مما يسهل عليهم التقاط نقاط الدخول دون الحاجة لمراقبة الشاشة طوال اليوم.
المتداولون التحليليون الذين يقدرون المدرج التكراري بأربعة ألوان كأداة تشخيص للزخم – لتحديد سريع ما إذا كان الضغط الصعودي أو الهبوطي يكتسب أو يفقد القوة.
جميع مستويات الخبرة – MACD هو مذبذب أساسي، وهذا التطبيق يجعله أكثر سهولة من أي وقت مضى مع مرئياته النظيفة، وترميز الألوان الذكي، ونظام التنبيه القابل للتكوين بالكامل.
cGuru
الملخص
This indicator includes a built-in alert system with customizable pop-up and sound notifications for bullish and bearish MACD-signal line crossovers, with options to toggle alerts independently and prevent duplicates. Users can also enable vertical dotted lines on the chart to mark crossover events for easier historical analysis.
All parameters are fully customizable, including the periods for fast, slow, and signal moving averages, as well as the types of moving averages used (EMA, SMA, etc.). The indicator supports signals for crossovers and trend strength, and requires bar or tick data input. It is suitable for traders seeking a TradingView-compatible MACD with enhanced visual cues and real-time alerts on the cTrader platform.