
Beschreibung
Supertrend-Kanäle sind ein benutzerdefinierter Overlay-Indikator, der Tradern hilft, dynamische Unterstützungs- und Widerstandsbereiche, Einstiegssignale und Trailing-Stop-Loss-Niveaus mithilfe einer auf dem ATR basierenden Logik visuell zu identifizieren.
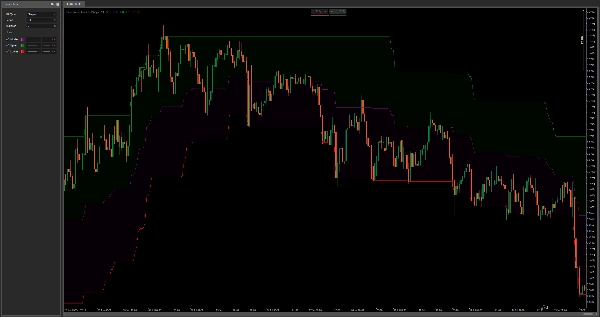
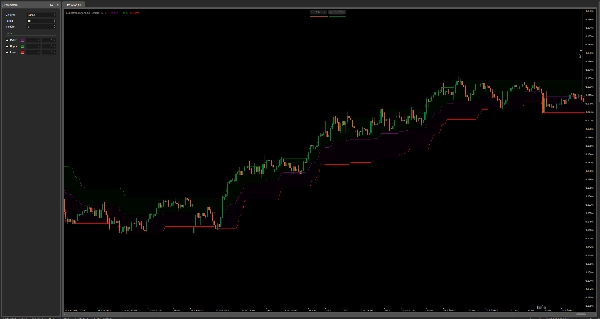
Der Indikator zeichnet drei Linien:
- Oberes Band (Grün) – fungiert als dynamischer Widerstand oder Trailing-Stop-Loss für Long-Trades.
- Unteres Band (Rot) – fungiert als dynamische Unterstützung oder Trailing-Stop-Loss für Short-Trades.
- Mittellinie (Lila) – dient als Mittelwert-Rückkehr-Niveau oder potenzieller Einstiegspunkt.
Die Bänder werden unter Verwendung des Average True Range (ATR) berechnet, multipliziert mit einem benutzerdefinierten Faktor (Multiplier), der zum Hoch/Tief der aktuellen Kerze addiert bzw. davon subtrahiert wird. Eine Glättungsmethode (wählbarer MA-Typ) wird auf den ATR angewendet, um die Reaktionsfähigkeit anzupassen.
Anwendung:
- Einstieg: Suchen Sie Einstiege in der Nähe der Mittellinie während Konsolidierungen oder nach Kreuzungssignalen.
- Trailing-Stop-Loss: Verwenden Sie oberes/unteres Band als dynamische Ausstiegszonen, um Gewinne zu sichern, während sich Trends ausdehnen.
- Unterstützung & Widerstand: Diese Bänder fungieren als adaptive Zonen, die die jüngste Volatilität widerspiegeln und helfen, potenzielle Wendepunkte zu erkennen.
Im Gegensatz zu den Standard-Bollinger-Bändern verankert dieser Ansatz die Bänder an Preisextremen plus Volatilität, nicht an einem gleitenden Durchschnitt, was ihn in Trendumgebungen reaktionsschneller und für diskretionären oder algorithmischen Handel anpassungsfähiger macht.
Zusammenfassung
Kundenbewertungen
5 | 50 % | |
4 | 50 % | |
3 | 0 % | |
2 | 0 % | |
1 | 0 % |


