present
Registrieren Sie sich und erhalten Sie $50 Rabatt auf Ihren ersten Kauf
Trading product for IM_AngleIndicator Indikator Forex Signal, image 1
IM_AngleIndicator
Indikator
1 käufe
Version 2.0, Jul 2026
Windows, Mac
Bewertungen: 3
Trading product for IM_AngleIndicator Indikator Forex Signal, image 2
Trading product for IM_AngleIndicator Indikator Forex Signal, image 3
Seit 11/11/2024
45.25M
Gehandeltes Volumen
124.29K
Pip-Gewinn
1
Verkäufe

Beschreibung

IM_AngleIndicator wandelt die Steigung eines einfachen gleitenden Durchschnitts in ein objektives, vergleichbares Winkelmaß um.

Die meisten "Winkel"-Indikatoren berechnen die Steigung aus der rohen Kursänderung, aber das Ergebnis hängt von der absoluten Skala des Instruments und vom Zeitrahmen ab – daher bedeutet derselbe Gradwert bei einem Währungspaar, einem Index oder einer Kryptowährung völlig unterschiedliche Dinge. IM_AngleIndicator löst dies, indem es die SMA-Änderung durch den ATR normalisiert: die Steigung wird in "ATR pro Kerze" ausgedrückt und dann in Grad umgerechnet. Auf diese Weise entspricht eine Steigung von 45° immer einer Bewegung von 1 ATR pro Kerze, unabhängig vom analysierten Instrument oder Zeitrahmen. Das Ergebnis ist eine konsistente Messung und Schwellenwerte, die im gesamten Portfolio wiederverwendet werden können.

Funktionsweise

  • Berechnet den SMA auf Schlusskursen entsprechend der gewählten Periode.
  • Misst dessen Änderung zwischen zwei aufeinanderfolgenden Kerzen und normalisiert sie durch Division durch den ATR.
  • Wandelt das resultierende Verhältnis mittels Arkustangens in Grad um und liefert einen Wert ungefähr zwischen −90° und +90°.
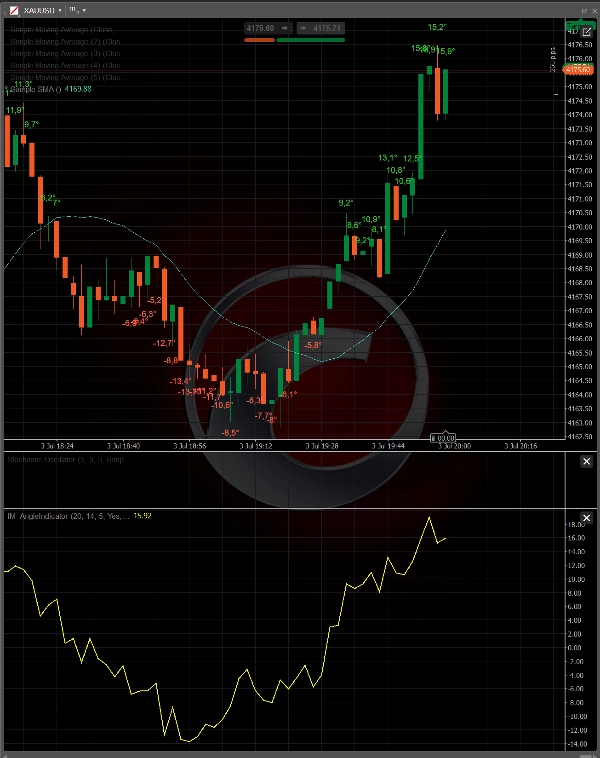
  • Stellt den Wert als Oszillator in einem eigenen Panel dar und fügt bei Überschreiten des festgelegten Schwellenwerts ein Label im Kurschart hinzu, das über dem Hoch (bullischer Trend) oder unter dem Tief (bärischer Trend) positioniert ist.

Hauptmerkmale

  • Steigungsmessung unabhängig vom Instrument und Zeitrahmen dank ATR-Normalisierung.
  • Konfigurierbarer Schwellenwert in Grad zur Filterung signifikanter Bewegungen und zum Ausschluss von Rauschen.
  • Richtungsabhängige farbcodierte Labels (grün für steigend, rot für fallend) mit einem ATR-basierten vertikalen Versatz für saubere Platzierung relativ zu den Kerzen.
  • Optimierte Handhabung von Chart-Objekten: Labels sind auf die neuesten Kerzen begrenzt, um die Leistung auch bei Charts mit langer Historie zu erhalten.
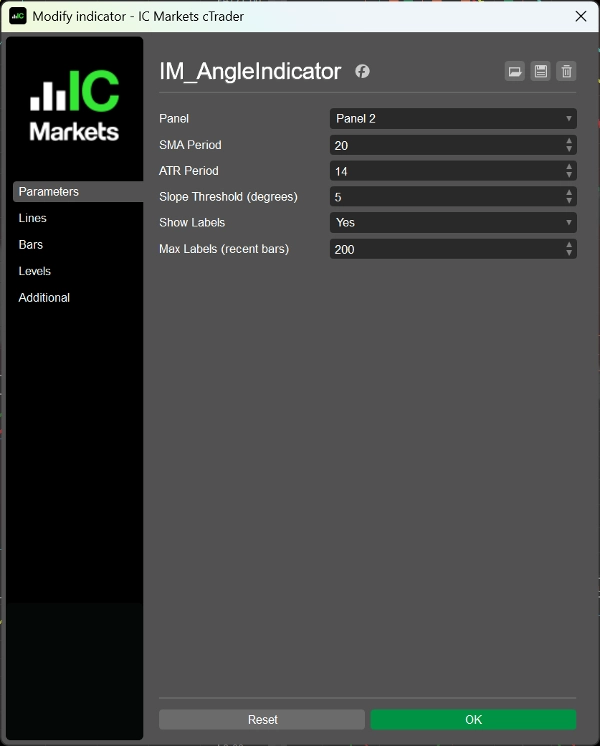
  • Vollständig anpassbare Parameter: SMA-Periode, ATR-Periode, Steigungsschwelle, Sichtbarkeit der Labels und maximale Anzahl der Labels.

Anwendungsfälle

  • Erkennung von starken Trendphasen gegenüber Seitwärtsbewegungen.
  • Richtungsbestätigung zur Unterstützung von Ein- und Ausstiegsstrategien.
  • Vergleich der Trendstärke über mehrere Instrumente hinweg mit demselben Schwellenwert.
  • Grundlage für die Entwicklung von cBots, die die normalisierte Steigung als Handelssignal verwenden.


Zusammenfassung

KI-Zusammenfassung
IM_AngleIndicator is a technical indicator that measures the slope angle of a simple moving average (SMA) normalized by the Average True Range (ATR). This normalization expresses the slope in degrees, making it comparable across different instruments and timeframes. The indicator calculates the SMA on closing prices, measures its change between bars, normalizes this change by the ATR, and converts the ratio into an angle between approximately −90° and +90°. It displays the angle as an oscillator in a dedicated panel and adds color-coded labels on the price chart to indicate strong bullish (green) or bearish (red) trends.

Key features include:
- ATR normalization for consistent slope measurement regardless of instrument or timeframe.
- Configurable angle thresholds to filter significant trend moves and reduce noise.
- Directional labels positioned relative to price bars for clear trend visualization.
- Customizable parameters such as SMA period, ATR period, slope threshold, label visibility, and maximum label count.
- Optimized label management for performance on long chart histories.

Use cases involve identifying strong trend phases, detecting potential reversals, confirming trade entries and exits, and comparing trend strength across multiple markets including Forex, commodities, and indices.
Indikatorprofil
Indikatorkategorie
Trend
Ausgabetyp
Visualisierung
Datenanforderungen
Nur Balken
Unterstützte Signale
Trendstärke

Kundenbewertungen

4.6
Bewertungen: 3
5
67 %
4
33 %
3
0 %
2
0 %
1
0 %
Kundenbewertungen
November 26, 2024
the entry feels calmer, but settings still need care.
November 19, 2024
The setup needs a cleaner reason to exist, but sideways markets can fake the filter.
November 13, 2024
kinda useful when the chart is messy. It can look better than it is during a lucky run.

Diskussion

Häufig gestellte Fragen (FAQ)

Forex
Signal
EURUSD
Commodities
XAUUSD
Über den cTrader Store verfügbare Produkte, einschließlich Handelsbots, Indikatoren und Plugins, werden von externen Entwicklern bereitgestellt und nur zu Informations- und technischen Zugriffszwecken verfügbar gemacht. cTrader Store ist kein Broker und erbringt keine Anlageberatung, persönlichen Empfehlungen oder eine Garantie für zukünftige Performance.

Das könnte Sie auch noch interessieren

Indikator
Prop
Forex
+13
🎯Automatically detects and visualizes classical chart patterns using multi-timeframe swing point analysis.
Indikator
ATR
Forex
+1
Trade fearlessly: auto-adjusts order blocks, manages risks, and ensures precision. Free for early users.
Indikator
BOS
CHOCH
+4
Dual-track market structure detection with BVC order flow confirmation and two-stage liquidity sweep validation.
Indikator
SMC
Prop
+15
Automatic Elliott Wave Detection with Professional Filters
Indikator
Volume
Channel
+5
Spots volatility squeezes before they fire — the compression phase everyone else misses.
Indikator
RSI
Prop
+14
Unlock Stochastic RSI PRO in cTrader! Overlay RSI, highlight zones, and identify divergences with customizable settings.
Indikator
ATR
RSI
+5
Advanced Anchored VWAP for cTrader: volatility bands, real‑time alerts & customizable session resets.
„KANDIKA HEAT MAP“-Logo
Beste Ratings
4.6
(5)
$19
Indikator
Color-Based Market Pressure & Volatility Visualizer The Kandika Heatmap Indicator
Indikator
Allow trader to draw multi trendlines in different timeframes on one chart,Give trader an overview of the current market
Indikator
BOS
MSS
+5
One indicator, full ICT/SMC picture — structure, OBs, FVGs, liquidity, Premium/Discount — with graded PRIME/SETUP signal
Indikator
ADX
ATR
+5
Identifies TRENDING, RANGING and VOLATILE markets with pullback detection. Anti-noise filter. Works on ANY chart.
Indikator
ATR
Forex
+6
UT Bot Alerts Nova: Advanced trend-following indicator using ATR for signals. Precise entries/exits.
Indikator
AI
ATR
+10
FX Sniper: Multi-pair Forex analysis tool. Features trend logic, adaptive pivots, and momentum filtering for major pairs
Indikator
Key Levels
Spots key hourly ranges and signals breakouts using arrows & colored background zones. Ideal for Gold.
Indikator
ATR
RSI
+5
Gold Emperor: AI-driven XAUUSD dominance. Dynamic pivots, matrix trend logic, and institutional shield protection.
Indikator
CHOCH
Key Levels
+4
Real-time compliance dashboard for prop firm challenges. Tracks daily loss, max drawdown, and profit target.
Indikator
BOS
Volume
+5
20/40/60-day IPDA lookback ranges, Premium/Discount/Equilibrium zones, and quarterly shift alerts — anchored to true dai
Indikator
RSI
MACD
+1
Precision Supply & Demand zones indicator—automatically plots key buy/sell areas on your chart for smarter entries.

Preis

Seit 11/11/2024
45.25M
Gehandeltes Volumen
124.29K
Pip-Gewinn
1
Verkäufe