
PriceLevels
อินดิเคเตอร์
4 การซื้อ
เวอร์ชัน 1.0, Jan 2025
Windows, Mac
5.0
รีวิว: 2
คำอธิบาย
คุณสมบัติหลัก:
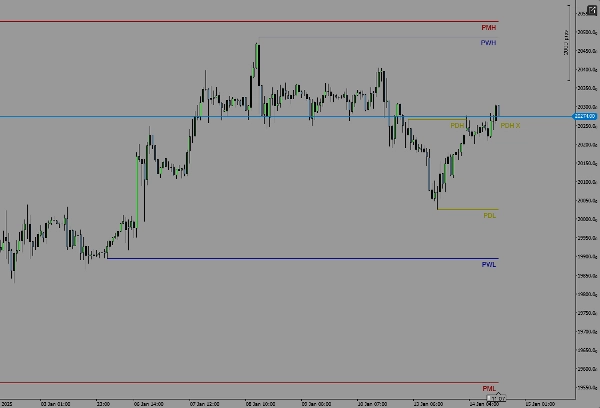
- แสดงระดับสูงสุดและต่ำสุดของเมื่อวานนี้
- แสดงระดับสูงสุดและต่ำสุดของสัปดาห์ที่แล้ว
- แสดงระดับสูงสุดและต่ำสุดของเดือนที่แล้ว
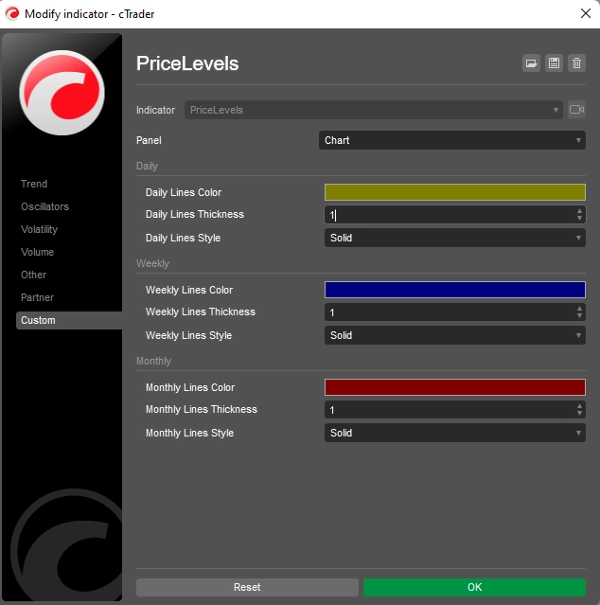
- สีและรูปแบบเส้นที่ปรับแต่งได้สำหรับแต่ละระดับ
วิธีการทำงาน:
ตัวบ่งชี้จะคำนวณราคาสูงสุดและต่ำสุดโดยอัตโนมัติสำหรับวันก่อนหน้า สัปดาห์ และเดือนตามกรอบเวลาของแผนภูมิของคุณ จากนั้นระดับเหล่านี้จะถูกวางเป็นเส้นแนวนอนบนแผนภูมิของคุณ เพื่อให้เห็นภาพชัดเจนของการเคลื่อนไหวราคาย้อนหลัง
ความเข้ากันได้:
- ออกแบบมาสำหรับแพลตฟอร์ม cTrader เท่านั้น
- ใช้งานได้กับทุกกรอบเวลาและเครื่องมือ
หากคุณมีคำถาม ข้อเสนอแนะ หรือคำแนะนำในการปรับปรุง โปรดติดต่อเราได้เลย! ความคิดเห็นของคุณมีค่าสูงและจะช่วยทำให้ตัวบ่งชี้นี้ดียิ่งขึ้น
ขอให้เทรดอย่างมีความสุข!
สรุป
สรุปโดย AI
PriceLevels is an indicator designed for the cTrader platform that automatically calculates and displays key historical price levels on trading charts. It plots the highest and lowest prices from the previous day, last week, and last month as horizontal lines, providing traders with clear visual references for past price action. The indicator supports all timeframes and instruments available on cTrader. Users can customize the colors and line styles for each displayed level to suit their charting preferences. This tool aids in identifying significant support and resistance zones based on recent historical data.
โปรไฟล์อินดิเคเตอร์
รีวิวจากลูกค้า
5.0
รีวิว: 2
5 | 100 % | |
4 | 0 % | |
3 | 0 % | |
2 | 0 % | |
1 | 0 % |
การสนทนา
คำถามที่พบบ่อย
ผลิตภัณฑ์ที่มีให้บริการผ่าน cTrader Store รวมถึงบอทการเทรด อินดิเคเตอร์ และปลั๊กอิน มีให้บริการโดยนักพัฒนาบุคคลที่สามและมีไว้เพื่อวัตถุประสงค์ในการเข้าถึงข้อมูลและทางเทคนิคเท่านั้น cTrader Store ไม่ใช่โบรกเกอร์และไม่ได้ให้คำแนะนำการลงทุน คำแนะนำส่วนบุคคล หรือการรับประกันผลการดำเนินงานในอนาคต


ราคา
ตั้งแต่ 05/01/2025
14
การขาย