
Supertrend - Multi-Timeframe
อินดิเคเตอร์
1 การซื้อ
เวอร์ชัน 1.0, Oct 2025
Windows, Mac
4.5
รีวิว: 2
คำอธิบาย
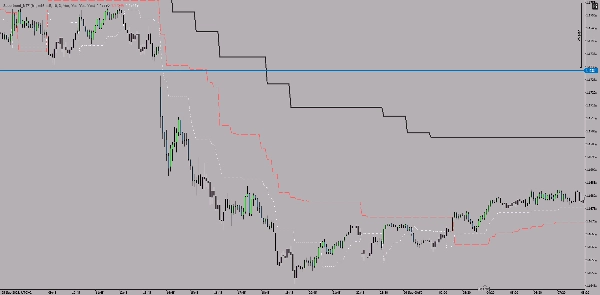
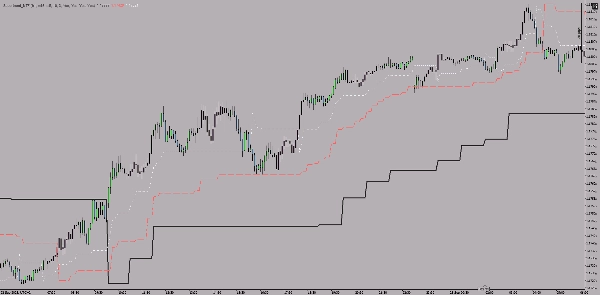
นี่คือตัวบ่งชี้ Supertrend หลายกรอบเวลาสำหรับแพลตฟอร์ม cTrader ที่แสดงเส้น Supertrend จากสามกรอบเวลาที่แตกต่างกันพร้อมกันบนกราฟเดียว
คุณสมบัติหลัก
การแสดงผลกรอบเวลาขนานสามกรอบ:
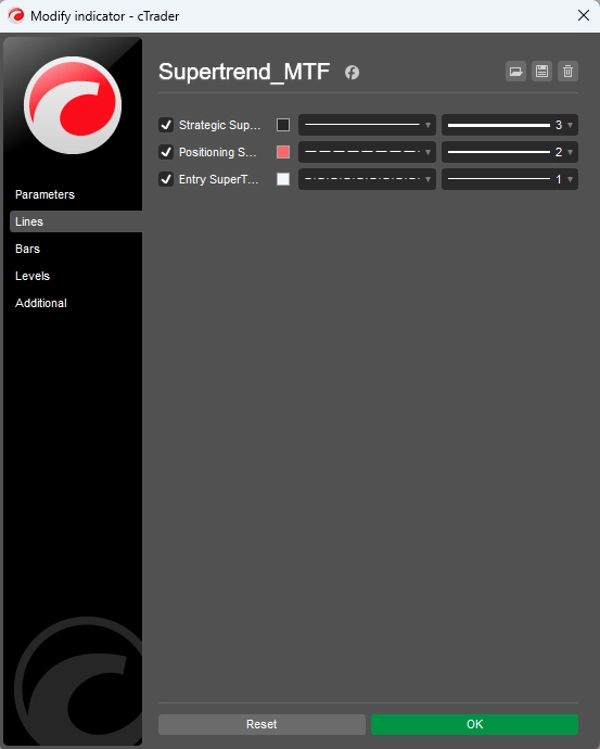
- กรอบเวลากลยุทธ์ (ค่าเริ่มต้น: 1 ชั่วโมง) - เส้นหนาและทึบ
- กรอบเวลาตำแหน่ง (ค่าเริ่มต้น: 15 นาที) - เส้นความหนาปานกลางแบบขีด
- กรอบเวลาเข้าซื้อ (ค่าเริ่มต้น: 5 นาที) - เส้นบางแบบจุด
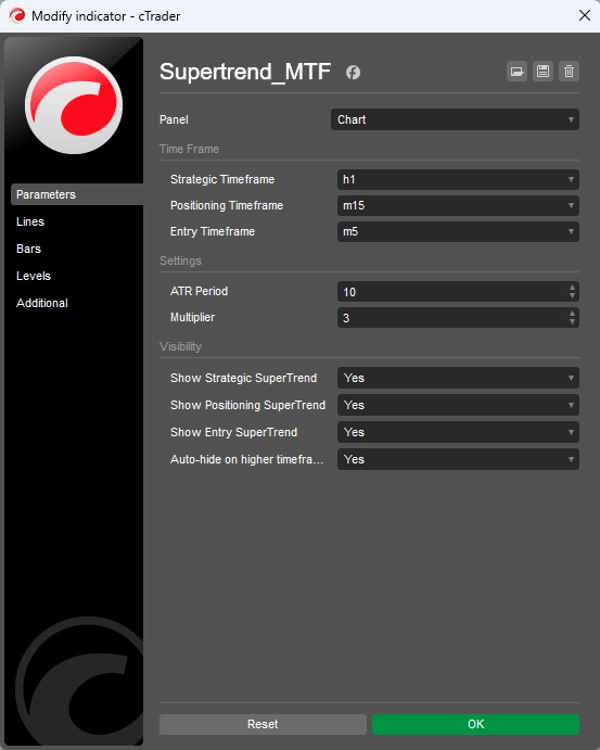
การตั้งค่าที่ปรับแต่งได้:
- ช่วง ATR (ค่าเริ่มต้น: 10)
- ตัวคูณ (ค่าเริ่มต้น: 3.0)
- แต่ละกรอบเวลาทั้งสามสามารถเปิด/ปิดใช้งานได้แยกกัน
- ซ่อนอัตโนมัติในกรอบเวลาที่สูงกว่า (ไม่บังคับ)
วิธีการทำงาน
ตัวบ่งชี้ใช้ตรรกะ Supertrend แบบคลาสสิกสำหรับทั้งสามกรอบเวลา โดยที่:
- แนวโน้มเป็นขาขึ้นเมื่อราคาสูงกว่าเส้น Supertrend
- แนวโน้มเป็นขาลงเมื่อราคาต่ำกว่าเส้น Supertrend
- ความหนาและรูปแบบเส้นที่แตกต่างกันช่วยแยกแยะกรอบเวลา
วัตถุประสงค์
ช่วยในการวิเคราะห์หลายกรอบเวลา: กรอบเวลาที่ใหญ่กว่าจะให้ทิศทางหลัก (กลยุทธ์) กรอบเวลากลางจะปรับตำแหน่ง และกรอบเวลาที่เล็กที่สุดจะระบุจุดเข้าซื้อเฉพาะ
สรุป
สรุปโดย AI
The Supertrend - Multi-Timeframe Indicator for the cTrader platform displays Supertrend lines from three distinct timeframes simultaneously on a single chart. It features a strategic timeframe (default 1 hour) shown as a thick solid line, a positioning timeframe (default 15 minutes) as a medium dashed line, and an entry timeframe (default 5 minutes) as a thin dotted line. Each timeframe can be individually enabled or disabled, with customizable settings including ATR period and multiplier. The indicator applies classic Supertrend logic: the trend is considered up when the price is above the Supertrend line and down when below. Different line styles and thicknesses visually distinguish the timeframes. This tool supports multi-timeframe analysis by providing the main directional trend from the larger timeframe, refined positioning from the middle timeframe, and specific entry points from the smallest timeframe. It is applicable across various markets including Forex, indices, commodities, stocks, and cryptocurrencies, and supports symbols such as BTCUSD, EURUSD, GBPUSD, XAUUSD, NAS100, and USDJPY.
โปรไฟล์อินดิเคเตอร์
รีวิวจากลูกค้า
4.5
รีวิว: 2
5 | 50 % | |
4 | 50 % | |
3 | 0 % | |
2 | 0 % | |
1 | 0 % |
รีวิวจากลูกค้า
October 13, 2025
The part worth keeping is the setup needs a cleaner reason to exist, and a few ugly trades are useful in the sample.
October 10, 2025
การสนทนา
คำถามที่พบบ่อย
BTCUSD
Forex
Breakout
Indices
EURUSD
Commodities
GBPUSD
NZDUSD
Prop
Scalping
Crypto
Stocks
XAUUSD
NAS100
USDJPY
ผลิตภัณฑ์ที่มีให้บริการผ่าน cTrader Store รวมถึงบอทการเทรด อินดิเคเตอร์ และปลั๊กอิน มีให้บริการโดยนักพัฒนาบุคคลที่สามและมีไว้เพื่อวัตถุประสงค์ในการเข้าถึงข้อมูลและทางเทคนิคเท่านั้น cTrader Store ไม่ใช่โบรกเกอร์และไม่ได้ให้คำแนะนำการลงทุน คำแนะนำส่วนบุคคล หรือการรับประกันผลการดำเนินงานในอนาคต


ราคา
ตั้งแต่ 05/01/2025
14
การขาย